
Your Saturday afternoon rush isn't random. That dead Tuesday wasn't either. Ice cream demand follows predictable patterns that most shop owners track in their heads instead of their systems. Weather drives 60-80% of your demand variance, yet most owners still order inventory based on last week's sales.
The real problem isn't that forecasting is hard. Traditional restaurant forecasting models break down for weather-sensitive businesses. A steakhouse can look at last Tuesday and predict next Tuesday. Your gelato shop? Last Tuesday was 72 degrees. Next Tuesday might be 58. Completely different business.
Why standard restaurant forecasting fails for frozen desserts
Restaurant forecasting assumes stable weekly patterns. Monday lunch crowds, Friday dinner rushes, Sunday brunch peaks. These patterns hold whether it's January or July. Your operation doesn't work that way.
Take a typical March week. Monday hits 68 degrees - you sell 340 scoops. Tuesday drops to 54 degrees - you move maybe 120. Wednesday bounces back to 71 - suddenly you're scrambling because you understaffed based on Tuesday's slow day. By Thursday's 52-degree rain, half your opened tubs are sitting there while your labor percentage shoots through the roof.
Forecasting models built for restaurants assume temperature independence. They focus on day-of-week patterns, monthly trends, special events. These matter for you too, but temperature swings can triple or halve your daily volume. A 15-degree drop might mean the difference between a $2,800 Saturday and a $900 Saturday. No amount of marketing changes that reality.
Most POS systems give you last year's sales for the same date. Useless when last year's April 15th was 78 degrees and sunny while this year's is 61 and cloudy. Historical sales without weather context tell you nothing.
Building your three-signal forecasting system
Small shops need simple, repeatable systems that actually get used. The framework that consistently works combines three data streams you already have access to: weather forecasts, adjusted historical sales, and local event calendars.
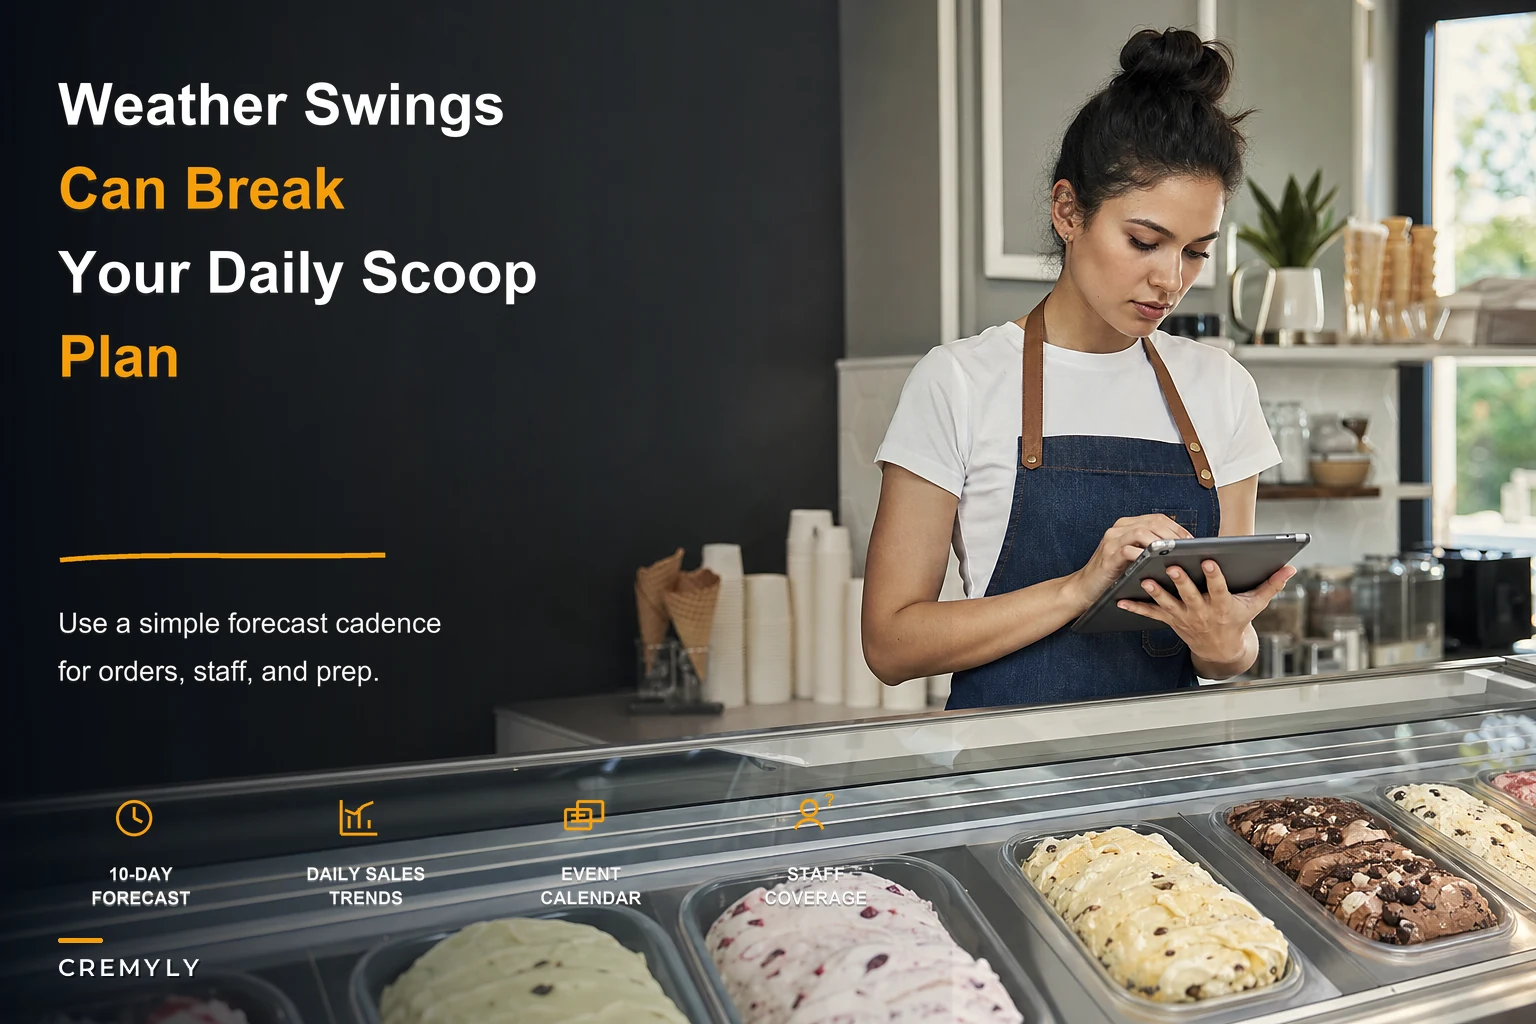
Keep your ice cream shop running smoothly.
Cremyly helps you manage every order, stock level, and staff shift with precision and ease.
- Real-time inventory tracking
- Order management dashboard
- Staff scheduling & shift coordination
No credit card required
Start with weather as your baseline predictor. Not just temperature - the combination of temperature, precipitation, and day type. A 75-degree Saturday moves different volume than a 75-degree Tuesday. A 70-degree day after three days of rain performs differently than the fourth consecutive 70-degree day.
Track your sales by temperature bands, not dates. Instead of knowing you sold $1,900 on May 15th last year, know you average $1,900 on 72-76 degree Saturdays without rain. Build these bands in 5-degree increments. After two months, patterns emerge.
-
Under 55°F
15-25% of peak daily sales
-
55-64°F
35-45% of peak daily sales
-
65-74°F
65-75% of peak daily sales
-
75-84°F
85-95% of peak daily sales
-
Above 85°F
100% peak (until it gets too hot around 95°F)
| Temperature band | Percent of peak daily sales |
|---|---|
| Under 55°F | 15-25% of peak daily sales |
| 55-64°F | 35-45% of peak daily sales |
| 65-74°F | 65-75% of peak daily sales |
| 75-84°F | 85-95% of peak daily sales |
| Above 85°F | 100% peak (until it gets too hot around 95°F) |
Raw temperature isn't enough though. The same 68-degree day performs differently based on context. First warm day after a cold week? Expect 20% above your typical 68-degree sales. Third consecutive 68-degree day? You'll hit your normal band. Pure historical matching fails because context matters more than absolute temperature.
Your second signal - adjusted historical sales - requires cleaning your data for comparability. Strip out anomalies first. That day the Little League championship ended at the park next door and you sold 500 cones in an hour? Flag it. The afternoon your freezer died and you closed at 3 PM? Flag it. You need clean baseline data, not outliers.
Then adjust for growth. If you're averaging 8% more traffic than last year, multiply last year's comparable weather days by 1.08. Simple math, but most shops skip this step and wonder why their forecasts consistently run low.
Flag anomalies like tournaments or freezer failures in your POS immediately so they don't skew your baseline bands.
The third signal - event calendars - acts as your variance predictor. Local schools, sports leagues, festivals, construction projects. A youth soccer tournament at nearby fields might double your Saturday afternoon traffic. Road construction that blocks your main access? You could lose 40% of drive-by traffic for weeks.
Turning forecasts into ordering decisions
Forecasting without action is just expensive guessing. Most shops order weekly from their main supplier, sometimes bi-weekly for specialty items. This constraint shapes how you use your forecasts.
Look at the 10-day weather forecast every Sunday night. Not the hourly breakdown - just daily highs, precipitation probability, and cloud cover. Score each day using your temperature bands. A week with three days above 75°F needs different inventory than a week hovering around 60°F.
Calculate your base needs first. If next week projects as a 65-70°F average week, and you typically move 12 gallons of vanilla during those conditions, that's your baseline. Then adjust for day distribution. If Saturday and Sunday look warm but weekdays look cool, shift your proportion. Maybe 14 gallons with heavy weekend production, light weekday pars.
The mistake shops make is ordering for the best-case scenario, especially heading into weekends. "What if Saturday hits 78 degrees and we run out?" But carrying inventory for perfect conditions means waste when reality delivers 71 degrees and clouds. Better to set pars for 80% of projected demand and have backup plans for unexpected rushes. Emergency supplier runs, simplified menu options, pushing certain flavors when others run low - these contingencies cost less than routine overordering.
Your ordering formula:
-
Base weekly needs (from temperature band average)
-
Plus event adjustments (tournaments, festivals adding 20-30%)
-
Plus growth factor (year-over-year increase)
-
Minus current inventory
-
Equals order quantity
Most shops eyeball the freezer, remember last week was busy, and order "about the same, maybe a bit more." Then temperatures drop 10 degrees, half the product sits, and margin evaporates through waste.
This simple workflow maps forecasts to order quantities and contingencies.
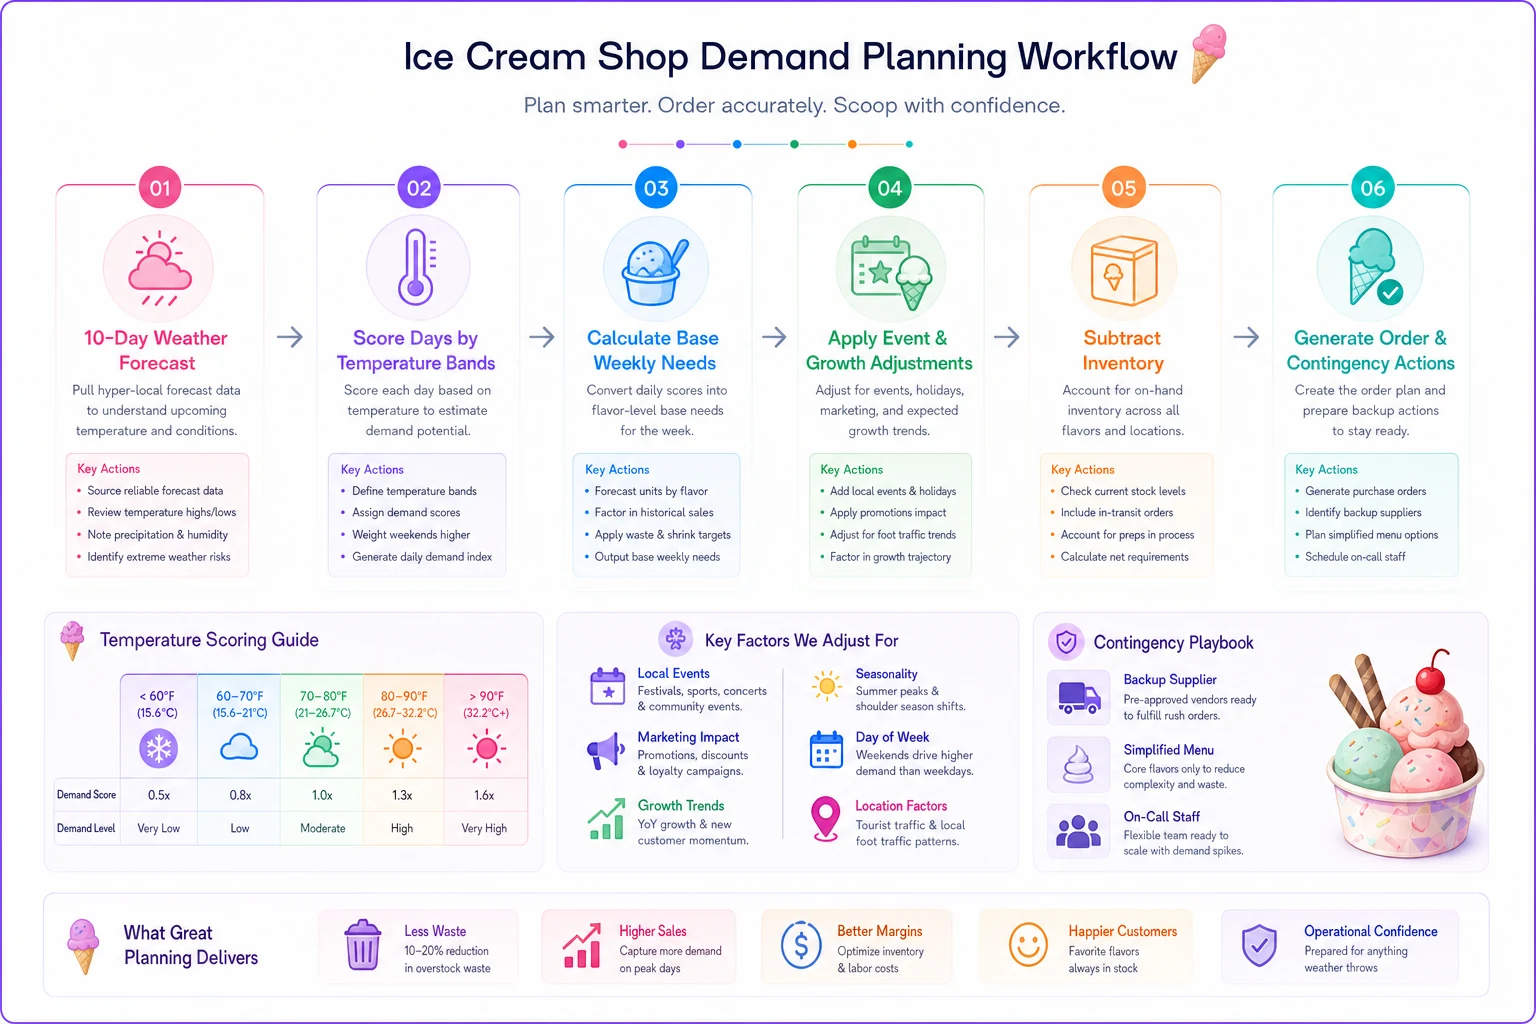
Keep a short checklist of steps so ordering stays consistent.
Connecting staffing to weather predictions
Labor scheduling breaks most ice cream shops. You can't just mirror last week's schedule when weather drives such massive swings. A fully-staffed Saturday during unexpected rain means your labor might hit 45% of sales. Meanwhile, understaffing a surprise 78-degree Sunday sends wait times through the roof and customers to your competitor.
Build your staffing model on the same temperature bands as your sales forecasting. If 70-75°F Saturdays average $2,400 in sales and you target 25% labor, you need $600 in scheduled labor. At $15/hour average wage, that's 40 hours of coverage. Maybe that's two morning people, three afternoon, two evening. The exact distribution depends on your traffic patterns, but the total hours come from weather-predicted sales.
The challenge is your 10-day forecast changes. Monday's forecast might show Saturday at 73°F. By Wednesday, it's showing 67°F. By Friday, it's back to 71°F. You can't rewrite the schedule daily, but you need flexibility.
Create contingency shifts. "On-call" sounds corporate, but the concept works for small shops too. Have conversations like: "Sarah, Saturday is looking like it might be slow with this weather. I'll text you by 10 AM if we need you at noon." Most employees prefer knowing they might work versus definitely working a dead shift.
Your weather-based scheduling system needs three components: Base schedule: Built from 10-day forecast, posted normally Flex positions: Additional shifts triggered by updated forecasts Cut protocol: Rules for sending people home if weather turns
A realistic example: Thursday's forecast shows Saturday warming to 76°F. You add a flex position for Saturday afternoon. Friday night, the forecast shifts to 78°F and sunny. You confirm the flex position. Saturday morning arrives cloudy and 71°F. You keep the flex person but might cut them early if afternoon traffic stays light.
When forecasting actually matters (and when it's just overthinking)
Not every decision needs complex forecasting. Daily flavor rotation? Probably overthinking. Whether to staff that fourth person on Memorial Day weekend? Definitely needs forecasting.
High-impact decisions that benefit from weather forecasting:
-
Weekly base ingredient orders (milk, cream, sugar)
-
Weekend staffing levels
-
Promotional timing
-
Seasonal flavor transitions
-
Special event preparation
Low-impact decisions where simple rules work better:
-
Daily cone inventory
-
Napkin restocking
-
Single-shift adjustments
-
Topping quantities
The framework pays off most during transition periods. That two-week stretch in March when winter breaks? The October weeks when temperatures swing 25 degrees day-to-day? These periods destroy margins for shops running blind. One Michigan shop lost roughly $8k in margin every April from overordering during false spring weeks. Simple weather tracking cut that by about 70%.
Perfect forecasting isn't the goal. Avoiding the massive misses is. The Sunday you're desperately understaffed. The week you order for summer and get spring. The inventory that expires because this May runs 10 degrees cooler than last May.
Setting up your tracking system (without complex software)
You don't need sophisticated systems to start. A basic spreadsheet tracking daily sales, high temperature, and precipitation gets you 80% there. Most shops already collect this data - they just don't connect it systematically.
Your minimum tracking spreadsheet:
-
Date
-
Day of week
-
High temperature
-
Rain? (Yes/No)
-
Total sales
-
Customer count
-
Notes (events, problems, anomalies)
After 60 days, patterns become obvious. Graph sales against temperature. Color-code by day of week. The correlation jumps off the page. That scatter plot showing your Tuesday-Thursday sales clustered by temperature bands? That becomes your ordering guide.
The evolution usually follows this path: First, owners track manually for a month, see the patterns, and start adjusting orders. Then they realize the daily data entry takes five minutes but saves hundreds in waste. Eventually, they want automated weather data pulls and sales predictions. That's when operational software starts making sense.
Modern AI-powered operational platforms can automate this entire workflow. Pull weather data automatically, correlate with POS sales, generate ordering suggestions, even create weather-adjusted staff schedules. But the underlying logic remains simple: temperature predicts demand, demand drives orders and staffing.
A real framework in action
A gelato shop in Denver went through March chaos - 70 degrees Monday, snow Wednesday, 65 degrees Saturday. Their previous approach: order based on last week, schedule based on hope, pray for good weather.
After implementing temperature band tracking, they discovered their break-even point sat right around 62°F. Below that, only destination customers showed up. Above it, foot traffic kicked in. They built their entire operation around that threshold.
Weekly process became:
-
Sunday
Check 10-day forecast
-
Monday
Place base orders for projected temperature bands
-
Wednesday
Adjust weekend staffing based on updated forecast
-
Friday
Final weekend prep based on 48-hour forecast
-
Daily
Track actual vs. predicted, note variances
Results after one season: waste dropped from about 12% to 4%, labor percentage stabilized around 24% (from swinging between 19-35%), and weather-driven stockouts virtually disappeared. Not from complex modeling - from consistent, simple tracking and response.
The biggest change wasn't the numbers though. It was operational confidence. Instead of constantly reacting, they started anticipating. Slow Tuesday? Expected and staffed accordingly. Busy Thursday? Inventory ready. The anxiety of weather-driven retail faded into manageable variation.
Making forecasting stick as a habit
Most forecasting systems fail because they require too much daily effort. The shop gets busy, tracking stops, and you're back to guessing. Building habits that stick means starting simple and gradually adding sophistication.
Start with just temperature and sales. Every night at close, write down the high temperature and total sales. Do this for two weeks before adding anything else. Once that habit forms, add precipitation. Then customer counts. Then special notes. But only after each previous habit is automatic.
Collection points that work:
-
Morning
Check weather forecast while making coffee
-
Afternoon
Note actual temperature during peak hours
-
Evening
Record sales during close-out procedures
Tie data collection to existing routines. If you already check sales during close-out, add temperature then. If you review next day's schedule each morning, check weather then. New habits fail. Expanded routines succeed.
After three months of basic tracking, most shops see enough value to maintain the system. The first time you nail a tough weekend forecast, avoiding both waste and stockouts, the system proves itself. The second time you confidently send staff home during a weather shift, saving hundreds in labor, it becomes essential.
Moving beyond reactive operations
Weather-driven demand feels like chaos only when you're not tracking it systematically. Once you map the patterns, ice cream shop demand forecasting becomes less about prediction and more about preparation. You know the bounds of what might happen. You prepare for the range, not the exact number.
This shift from reactive to proactive operations changes everything. Inventory turns faster because you're not holding buffer stock for imaginary rushes. Staff morale improves because they're not standing around dead stores or scrambling through understaffed rushes. Margins stabilize because waste and emergency labor drops.
The framework described here - weather signals, adjusted historical sales, and event calendars - works because it matches how demand actually functions for seasonal dessert shops. Not through day-of-week patterns or monthly trends, but through temperature bands and weather contexts that drive customer behavior.
Operational software increasingly handles this correlation automatically, pulling weather data, analyzing sales patterns, and suggesting orders and schedules. But whether you're tracking in a notebook or using AI-powered platforms, the fundamental insight remains: your Saturday rush is predictable once you stop looking at dates and start looking at temperatures. The sooner you build systems around that reality, the sooner your operation moves from weather victim to weather prepared.
Ready to scoop up efficiency and grow your shop?
Join hundreds of ice cream shops using Cremyly to boost productivity, reduce waste, and delight customers with faster service.