


Your three-gallon tub of chocolate chip cookie dough cost $42 from your supplier. You're charging $4.50 for a single scoop. Sounds profitable until you realize you're getting 68 scoops per tub instead of the 96 you calculated. That missing math just turned your expected 65% gross margin into 38%.
This gap between theoretical portion costs and actual serving yields happens in nearly every ice cream shop. The problem gets worse when you add topping costs, waffle cone breakage, sample spoons, and the fact that your newer staff members are serving 4.5oz "singles" while your veterans stick closer to 3.5oz.
Why traditional food cost calculators fail ice cream operations
Restaurant pricing formulas assume consistent portions. A burger is a burger. An 8oz steak stays 8oz. Ice cream changes density between flavors, scoop sizes vary by staff member, and your yield per tub fluctuates based on temperature, how long the tub's been open, and whether someone's digging for chocolate chunks at the bottom.
Vanilla bean versus rocky road tells the story perfectly. The vanilla might yield 92 scoops from a three-gallon tub at 4oz each. Rocky road, packed with marshmallows and nuts, only gives you 76 scoops at the same portion size because staff unconsciously compensate for the mix-ins by packing scoops tighter.
Most shops discover these discrepancies during inventory counts, wondering why they're burning through premium flavors faster than basics. By then, you've already locked in menu prices that don't reflect actual costs.
The standard per-scoop cost calculator assumes perfect conditions: exact portion sizes, zero waste, consistent density across flavors. Real operations face temperature variations affecting scoopability, different scoop sizes for kids versus adults, broken waffle cones that get tossed, and mint chocolate chip somehow always running out first during rushes.
Breaking down actual portion economics with three real tub scenarios
Scenario A: Basic vanilla in a high-volume shop
Keep your ice cream shop running smoothly.
Cremyly helps you manage every order, stock level, and staff shift with precision and ease.
- Real-time inventory tracking
- Order management dashboard
- Staff scheduling & shift coordination
No credit card required
Starting point: 3-gallon tub at $28 wholesale
Theoretical yield: 96 scoops at 4oz each (384oz total)
Actual tracked yield: 89 scoops average
Morning shift: 92 scoops (experienced staff)
Evening shift: 86 scoops (newer team)
Weekend rushes: 84 scoops (speed over precision)
Raw per-scoop cost: $28 ÷ 89 = $0.31
-
Cup or cake cone
$0.08
-
Napkin and spoon
$0.03
-
Sample tastes (averaged)
$0.02
-
Freezer burn waste (2% of tub)
$0.01
True cost per basic single: $0.45
At $3.75 menu price: 88% gross margin
At $4.50 menu price: 90% gross margin
Scenario B: Premium flavor with mix-ins
Starting point: 3-gallon tub of salted caramel pretzel at $46 wholesale
Theoretical yield: 96 scoops at 4oz
Actual tracked yield: 71 scoops
Dense base reduces scoopability. Pretzel pieces create irregular portions. Customers expect visible mix-ins in each scoop.
Raw per-scoop cost: $46 ÷ 71 = $0.65
-
Waffle cone (60% of orders)
$0.22
-
Extra caramel drizzle (requested 30% of time)
$0.08
-
Cup/spoon/napkin
$0.11
True cost per premium single: $1.06
At $4.50 menu price: 76% gross margin
At $5.75 menu price: 82% gross margin
Scenario C: Specialty small-batch flavor
Starting point: 1.5-gallon tub of lavender honey at $38 wholesale
Theoretical yield: 48 scoops at 4oz
Actual tracked yield: 41 scoops
This gets kept at warmer temperature for texture. Higher melt loss during service. Often served in smaller "flight" portions.
Raw per-scoop cost: $38 ÷ 41 = $0.93
-
Premium cup for Instagram appeal
$0.15
-
Honeycomb garnish
$0.12
-
Branded spoon
$0.05
True cost per specialty single: $1.25
At $5.50 menu price: 77% gross margin
At $6.75 menu price: 81% gross margin
The markup decision table that actually works
Rather than applying blanket pricing across your menu, segment flavors by operational reality:
| Category | Cost Range | Target Margin | Markup Multiple | Menu Position |
|---|---|---|---|---|
| Basics (vanilla, chocolate) | $0.35-0.50 | 85-90% | 8-10x | $3.50-4.25 |
| Standards (cookies & cream, strawberry) | $0.50-0.75 | 82-87% | 6-8x | $4.25-5.00 |
| Premium (loaded flavors) | $0.85-1.25 | 78-83% | 4.5-6x | $5.25-6.25 |
| Specialty (seasonal, small-batch) | $1.10-1.65 | 75-80% | 4-5x | $5.75-7.00 |
| Vegan/Alternative base | $1.25-1.85 | 72-78% | 3.5-4.5x | $6.00-7.50 |
Customers mentally anchor on your basic flavors but judge value on premiums. Price basics competitively, maintain margins on standards, and capture premium on specialties where customers expect higher prices.
High-volume versus boutique pricing strategies
High-volume model (500+ transactions daily)
Focus on speed and consistency. Your money comes from volume, not margin per scoop.
-
Pre-portioned cups at 3.5oz, 5oz, 7oz
-
Limited flavor rotation (12-16 total)
-
Single-size pricing dominates
-
Minimal toppings to reduce complexity
Pricing structure:
-
Single
$3.75-4.25
-
Double
$5.25-5.75
-
Triple
$6.50-7.00
The math: At 600 daily scoops averaging $0.48 cost and $4.25 price, you're generating $2,262 in gross profit daily. The efficiency gains from standardization often matter more than premium pricing.
Quick-serve optimization reduces labor cost per transaction by roughly 40%, letting you maintain overall margins despite lower menu prices. Your per-scoop cost calculator should factor in labor efficiency gains from simplified operations.
Premium boutique model (150-250 transactions daily)
Every scoop becomes an experience. Higher prices work because you're selling craftsmanship.
Operational setup requires different thinking:
-
Hand-packed portions at 4.5oz standard
-
24-32 rotating flavors
-
Extensive topping bar
-
Flight options for sampling
Pricing structure:
-
Single
$5.75-6.50
-
Double
$8.50-9.25
-
Flight (4 mini)
$10.50-12.00
The economics shift completely. Average ticket jumps from $5.80 in high-volume to $14.20 in boutique settings. You're serving one-third the customers but generating similar or better total margins through premium positioning.
Boutique models require 2.5x the refrigeration capacity per daily transaction. Those 32 flavors need dedicated freezer space whether they sell or sit. Factor monthly equipment costs into your per-scoop calculations.
Tracking and adjusting portion costs in real operations
Smart operators weigh random scoops throughout shifts. Not every scoop—that disrupts flow—but spot-check three to five portions per shift. Track which staff members, which flavors, and which rush periods create portion variance.
One Seattle shop discovered their afternoon shift was serving 18% larger portions than morning crew. Simple reason: afternoon team dealt with harder-frozen ice cream straight from delivery, overcompensating with pressure that packed more product per scoop. Solution wasn't training or discipline—they simply tempered new tubs for 20 minutes before service.
Build a portion tracker that captures flavor name and base cost, actual weight served, time of service, staff member, and cup or cone type.
Weigh a few random singles during a lull to get reliable data without disrupting service.
After two weeks, patterns emerge. Maybe your cookie dough consistently under-yields because chunks stick to the scoop. Perhaps doubles aren't truly double—they're 1.7x a single portion. These insights drive menu engineering decisions.
Monthly recalibration keeps pricing aligned with reality. If your average single portion crept from 4oz to 4.4oz over summer when ice cream stays softer, that 10% increase in product cost needs addressing through price, portion, or process adjustments.
When premium pricing makes sense (and when it's business suicide)
Location context determines pricing power more than product quality. The same lavender honey gelato that commands $7.50 near downtown galleries might struggle at $5.50 in suburban strip malls.
Premium pricing works when foot traffic includes tourists or destination diners, average local income exceeds $77k household, competitors price similarly or higher, you offer exclusive flavors unavailable elsewhere, and presentation justifies the premium (branded cups, garnishes, experience).
Premium pricing fails when families with kids dominate customer base, direct competition exists within 3 blocks, your location depends on repeat visits, speed matters more than experience, and delivery apps show price comparisons.
A shop near UC Berkeley switched from premium boutique to high-volume pricing after realizing students prioritized quantity over quality. Same product, same costs, but dropping prices 20% while increasing portion sizes drove 3x transaction volume. Net profit increased 40% despite lower margins per scoop.
The hidden costs that destroy ice cream margins
Sampling waste: Average shop gives away 3-4% of product volume in samples. During summer tourist season, this climbs to 6-8%. At $35 per tub average, sampling costs $400-800 monthly for a typical 20-flavor shop.
Temperature loss: Every time a tub moves from back freezer to service freezer to counter, product quality degrades. Most shops lose 5% of inventory to freezer burn, crystallization, or separation. Premium gelatos with higher butterfat suffer more—up to 8% loss.
Topping creep: Free toppings gradually become more generous. Track sprinkle usage—if you're going through 20% more rainbow sprinkles than three months ago with same transaction counts, portion creep is eating margins.
Cone breakage: Waffle cones break. House-made ones break more. Factor 8-12% breakage for house-made, 3-5% for pre-made. At $0.28 per house-made cone, breakage adds $0.03 to every cone served.
Prep labor: Small-batch flavors require 2-3 hours of prep per 3-gallon batch. At $18/hour with overhead, that's $54 in labor before the first scoop. Divide by 75 real-world portions and you've added $0.72 per scoop in labor alone.
Implementing variable pricing without alienating customers
Customers accept price variation when logic feels transparent. They understand lobster costs more than chicken. Apply similar transparency to ice cream.
-
House Classics
$4.25 (vanilla, chocolate, strawberry)
-
Signature Flavors
$5.25 (anything with mix-ins)
-
Artisan Collection
$6.25 (small-batch, seasonal)
-
Alternative Base
$6.75 (oat milk, coconut, etc.)
Train staff to explain naturally: "Our black sesame is part of our artisan collection—we make it in small batches twice weekly with imported tahini."
Digital menu boards make price adjustments seamless. Wednesday's leftover lavender honey becomes Thursday's happy hour special at $4.75, moving inventory while maintaining margin above cost.
Track customer response through transaction patterns. If specialty flavor sales drop 30% after a price increase, you've hit resistance. If they only drop 8%, you probably underpriced initially.
Building your operational tracking system
Spreadsheets work until they don't. Most shops start with basic Excel tracking, then drown in data entry as they scale. The evolution typically follows this pattern:
-
Paper logs of daily flavor counts
-
Excel with basic formulas
-
Cloud spreadsheet with multiple users creating version chaos
-
Realization that manual tracking steals 2 hours daily
Build systematic tracking from day one. Weight three portions per flavor weekly. Log wholesale price changes immediately. Track yield variations by shift.
AI-powered operational software handles this automatically, pulling cost data from suppliers, tracking portions through POS integration, and flagging when margins drift from targets. These platforms turn what used to require daily spreadsheet management into automated dashboards that alert you when lavender honey drops below 70% margin or when evening shift portions exceed targets.
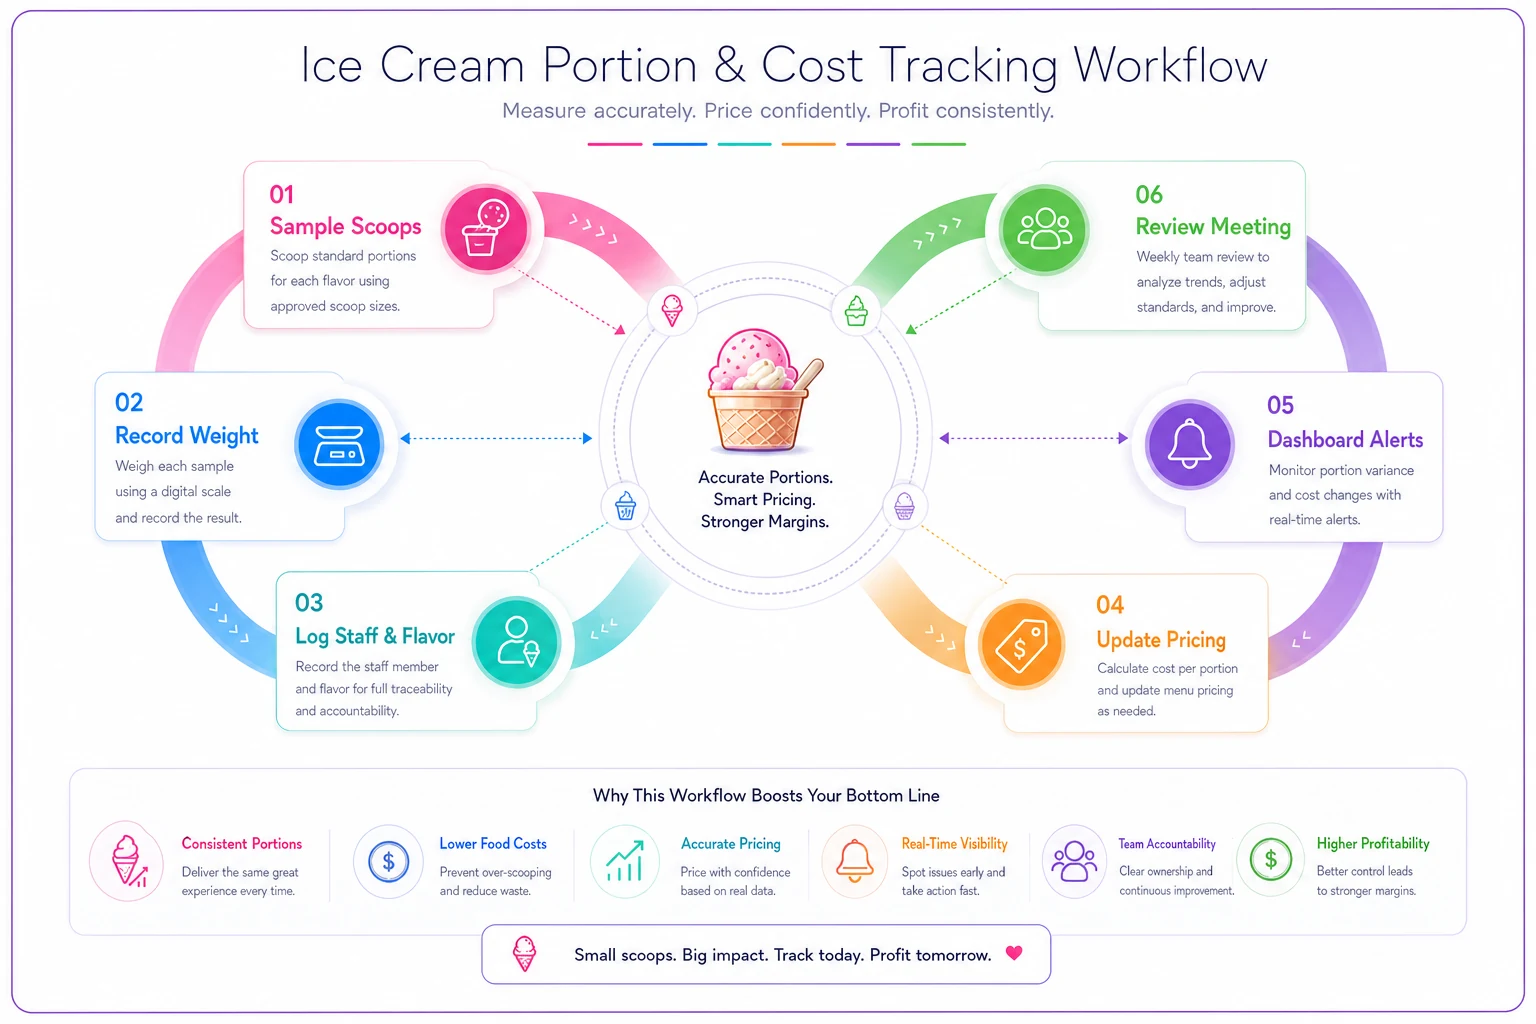
Use this workflow to capture, analyze, and act on portion data quickly.
Seasonal adjustments and smart menu engineering
Summer and winter require different strategies. Ice cream consumption patterns shift dramatically, and your pricing should adapt.
Summer brings challenges. Portions naturally increase 5-10% as ice cream softens. Sample requests triple during tourist season. Premium flavors sell better in heat (weird but true). Larger sizes become more popular.
Price accordingly. Maybe summers see 25-cent increases across the board, positioned as "peak season pricing" like hotels and airlines normalized years ago.
Winter requires opposite thinking. Reduce flavor count to minimize waste. Focus on indulgent, warming flavors (hot fudge becomes king). Promote pints over scoops. Consider delivery partnerships despite platform fees.
Plan price changes quarterly, not annually. Your per-scoop cost calculator should include seasonal variables, not just static costs.
Profitable ice cream pricing isn't about applying restaurant formulas or guessing at markups. It requires understanding actual yields, tracking real portions, and adjusting for operational realities your competitors probably ignore.
The shops thriving aren't necessarily serving better ice cream. They're operating with better data. They know their Tuesday morning vanilla yields 94 scoops while Saturday night's cookies and cream barely produces 72. They price accordingly, track consistently, and adjust rapidly.
Whether you run a high-volume operation prioritizing efficiency or a boutique shop selling experiences, the math remains constant: know your true per-scoop cost, factor in hidden expenses, and price for your market reality, not theoretical ideals.
Start with the basics. Weigh ten random portions tomorrow. Track which flavors consistently under-yield. Calculate true costs including labor, waste, and samples. Then adjust prices based on actual data instead of hoping margins materialize.
The difference between struggling shops and profitable ones often comes down to understanding these numbers. Your $4.50 single scoop might be perfect—or it might be slowly destroying your business. The only way to know is to track, measure, and adjust based on operational reality rather than theoretical calculations.
Ready to scoop up efficiency and grow your shop?
Join hundreds of ice cream shops using Cremyly to boost productivity, reduce waste, and delight customers with faster service.