

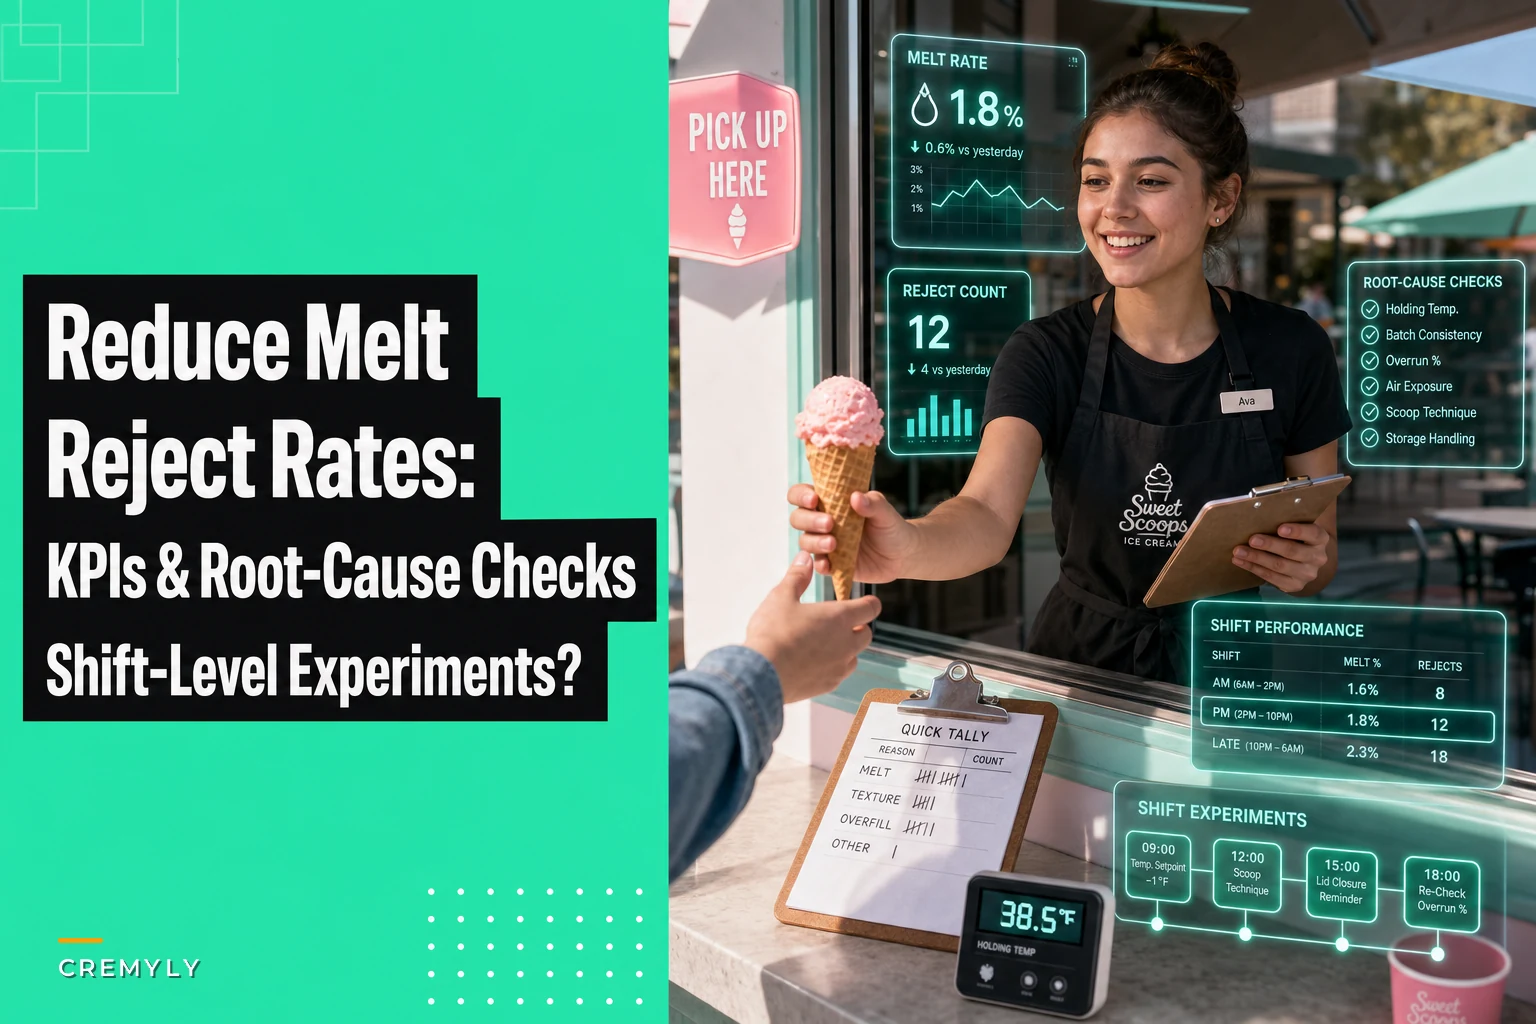

Walk into any ice cream shop during a busy Saturday afternoon and you'll spot it immediately - the sticky puddles on counter surfaces, the frustrated server frantically wiping down another cone that started dripping before it reached the customer, the remake that just went out because the first one collapsed. Most owners shrug this off as "part of the business," but when you actually track melt rates across different shifts, the numbers become uncomfortable.
A typical 200-transaction Saturday might generate anywhere from 8 to 25 melted remakes depending on your operational setup. At roughly $4.50 average ticket value per serving, even a modest 4% melt rate burns through $36 in direct product waste. Factor in the time cost of remakes, customer frustration, and the ripple effect on service speed, and you're looking at a much bigger operational problem.
Most melt issues follow predictable patterns that become obvious once you start measuring them properly. Temperature control problems show up consistently during specific time windows. Equipment issues create melt clusters around particular serving stations. Even something as basic as your team's scooping technique can drive melt rates from a manageable 2% up to an expensive 7% on identical products.
Building a melt-tracking system that actually works
Forget complicated spreadsheets or expensive point-of-sale integrations. The most effective melt-tracking systems start dead simple - a basic tally sheet at each serving station with columns for time, product type, and suspected cause. Train your team to mark every single remake, not just the dramatic ones.
After tracking for just three days, patterns emerge fast. Maybe vanilla soft-serve melts at twice the rate of chocolate between 2-4pm. Perhaps waffle cones fail more often when served by newer staff. These aren't random events - they're operational signals pointing directly at fixable problems.
Here's what a functional tracking sheet looks like:
| Time Block | Product | Station | Melt/Reject | Quick Note |
|---|---|---|---|---|
| 12:00-12:30 | Soft vanilla | Front | Melt | Too warm display |
| 12:45-1:00 | Waffle cone | Front | Break | Overfilled |
| 1:15-1:30 | Sundae | Back | Melt | Slow service |
| 2:00-2:15 | Soft chocolate | Front | Melt | Machine temp |
The "quick note" column is where the magic happens. Staff naturally start noticing patterns - "always happens after machine refill" or "only with new waffle batch." These observations become your roadmap for systematic fixes.
Temperature zones and why your freezer setting isn't the real problem
Everyone obsesses over freezer temperatures, but the real melt culprits hide in the journey from freezer to customer. Your ice cream experiences at least four temperature zones during service, and problems in any zone cascade into melt issues.
Keep your ice cream shop running smoothly.
Cremyly helps you manage every order, stock level, and staff shift with precision and ease.
- Real-time inventory tracking
- Order management dashboard
- Staff scheduling & shift coordination
No credit card required
Storage temperature sits around -10°F to -5°F in most shops. Display freezers run warmer, typically -5°F to 0°F, creating the first vulnerability. The serving counter introduces ambient temperature exposure, especially problematic during rushes when freezer doors stay open longer. Finally, there's the hand-off zone - that critical 30-60 seconds where product moves from server to customer.
One shop discovered their melt rate jumped 300% whenever their display freezer door stayed open more than 45 seconds continuously. Another found that moving their soft-serve machine just 18 inches away from the kitchen's heat output cut melt complaints by half. These aren't expensive fixes - they're positioning and workflow adjustments that cost nothing but attention.
The sneaky temperature problem nobody talks about? Inconsistent product rotation. When new stock goes directly from delivery truck to display freezer without proper tempering time, you get a mix of rock-hard and too-soft product in the same batch. Servers naturally grab the softer portions because they're easier to scoop, accelerating the melt timeline before the customer even orders.
Root-cause investigation without the detective work
When melt rates spike, most managers start randomly adjusting things - cranking down freezer temps, retraining staff, switching suppliers. This scattershot approach wastes time and rarely solves the core issue. Instead, run through this systematic check:
Equipment checks (10 minutes): Start with thermometer verification. Those cheap dial thermometers drift over time, sometimes reading 5-8 degrees off actual temperature. Check compressor cycling - if your freezer compressor runs constantly or cycles more than 6 times per hour, you've got a problem that'll only get worse. Door seals need the dollar bill test monthly - slip a bill in the door seal and close it. If you can pull it out easily, your seal is shot.
Keep a spare calibrated thermometer on hand for quick re-checks during shifts.
Service flow analysis (one shift): Watch how long products sit at each stage. Time from freezer-pull to customer-handoff should stay under 90 seconds for cups, 60 seconds for cones. Count how many times servers go back for forgotten toppings or napkins while product sits melting on the counter. Track whether rushed periods correlate with melt spikes - usually they do, but sometimes the pattern surprises you.
Product-specific patterns: Soft-serve melts fastest, obviously, but strawberry ice cream typically melts 15-20% faster than chocolate due to lower fat content. Gelato holds temperature better than ice cream but becomes unusable faster once it starts warming. These product quirks mean one-size-fits-all handling procedures guarantee unnecessary waste.
The shift experiment framework that proves what works
Running controlled experiments during actual shifts gives you real data instead of theories. Pick one variable, test it for exactly one week, measure the difference. No multiple changes, no exceptions, no "we'll also try this while we're at it." One change, one week, clear results.
Week 1: Pre-staging experiment During your 5-7pm dinner rush, pre-stage empty cups and cones at the serving station. Not the ice cream - just the vessels. Hypothesis: eliminating the fumbling-for-cups step cuts hand-off time by 20 seconds. Track melt rates before and after. One shop saw melt rates drop from 5.2% to 3.1% just from this change.
Week 2: Rotation protocol Implement strict FIFO (first-in-first-out) for display freezers with physical markers. Use colored tape to mark Tuesday's stock versus Thursday's stock. Measure whether consistent product temperature reduces melt variance. Most shops see a 15-25% improvement in consistency, though the absolute melt rate might not change much.
Week 3: Station assignment Designate one person as the "finisher" during rushes - they only hand off completed orders, never scoop. This person manages the critical temperature-sensitive final moments. Seems like overkill until you realize that 70% of melts happen in the last 30 seconds before customer hand-off.
Week 4: Temperature adjustment ladder Instead of cranking freezers to maximum cold, try stepped adjustments. Display freezer at -2°F, storage at -8°F, soft-serve at manufacturer spec plus 1 degree colder. The goal isn't maximum cold - it's optimal serving temperature that balances scoopability with melt resistance.
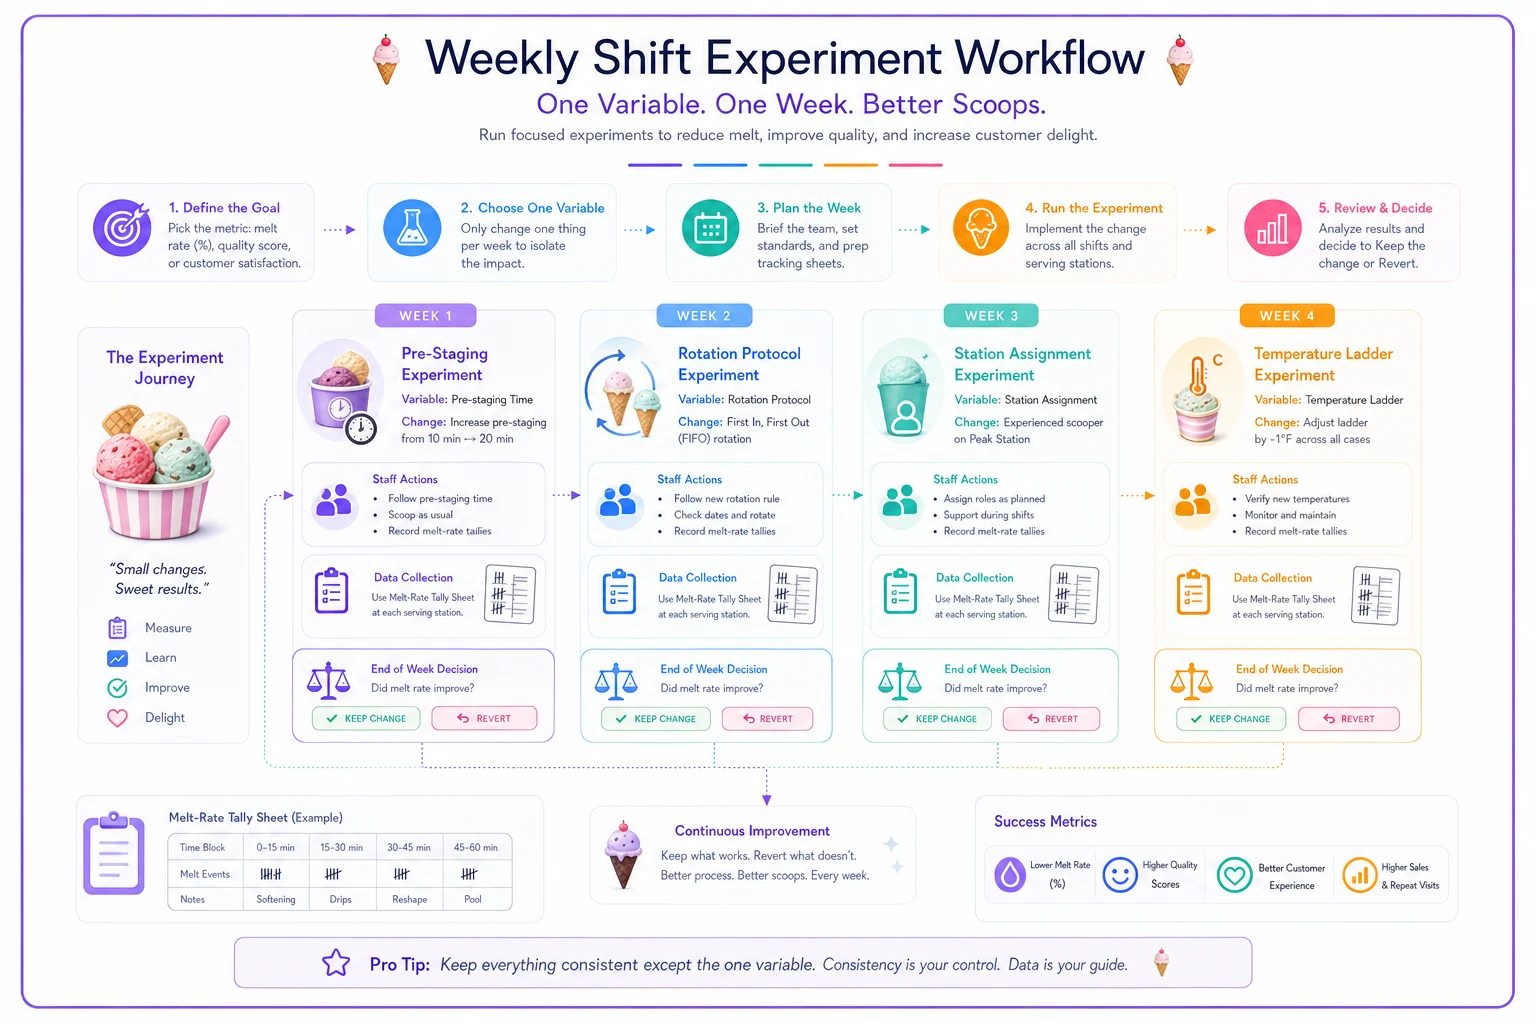
Visualize the weekly shift experiment workflow above.
Creating SOPs that stick (and actually reduce melted servings ice cream shop waste)
Standard operating procedures sound corporate and boring, but the right SOPs turn chaotic shifts into predictable operations. Make them specific enough to follow but simple enough to remember during a rush.
Your melt-prevention SOP should fit on an index card:
-
Pull product from back of freezer (coldest spot)
-
Door closed between every 2 scoops maximum
-
Cone fills
2 scoops, tap-settle, final swirl
-
Cup fills
level first scoop, mounded second
-
Hand-off within 15 seconds of completion
-
Remake threshold
visible drip = immediate remake
Notice what's not there? No temperature readings, no complicated decision trees, no exceptions. During service, your team needs binary decisions - do this or do that, never "it depends."
The remake threshold deserves special attention. Some shops try to save every serving, wiping drips, re-freezing soft portions, basically performing ice cream CPR. This always backfires. Clear remake criteria removes guilt and speeds service. "Visible drip = remake" means no arguments, no customer complaints, no hesitation.
When AI-powered tracking beats manual tallies
Manual tracking works, but it breaks down during exactly the moments you need it most - the crushing rushes where melt problems explode. AI-enhanced operational software starts making sense as a consistent measurement tool that never forgets to log issues.
Modern operational platforms can pull temperature data from smart sensors, correlate it with transaction timing, and identify patterns humans miss. When melt rates spike every Tuesday at 3:30pm, the system flags it immediately instead of waiting for someone to notice the pattern three weeks later. The AI component isn't replacing judgment - it's surfacing the data points that matter so managers can make better decisions faster.
The automation aspect really shines in experiment tracking. Instead of maintaining separate spreadsheets for each shift experiment, the system automatically segments data by time period, calculates statistical significance, and shows whether changes actually improved anything or just felt like they did. One platform implemented for a three-location chain discovered that their "problematic" location actually had lower melt rates than their "best" location - the difference was customer complaint patterns, not actual waste.
Seasonal adjustments nobody tells you about
Summer melt problems seem obvious, but winter creates its own chaos. Cold weather means customers spend longer deciding (product sits waiting), doors stay open longer (temperature fluctuations), and heating systems create hot spots near serving areas.
Spring and fall throw the wildest curveballs. Temperature swings of 30+ degrees between morning prep and afternoon rush mean your morning settings become worthless by 2pm. The shops that maintain consistent melt rates year-round don't chase the weather - they build buffers. That means slightly colder storage temps, shorter door-open intervals, and accepting that perfect scooping temperature is a luxury you can't always afford.
Something counterintuitive: the worst melt problems often happen on slow days, not busy ones. When it's dead, staff leave doors open while chatting. Product sits in display freezers way past optimal serving window. The one customer per hour gets ice cream that's been temperature-cycling for ages. Minimum velocity standards - rotating display stock every 2 hours regardless of sales - prevent this slow-day melt creep.
Financial reality check on melt reduction
Let's talk real numbers. A small shop doing 150 transactions daily with a 5% melt rate tosses 7-8 servings per day. At $4.50 average price and roughly 40% food cost, that's $11-12 daily in pure product waste. Multiply by 360 operating days and you're burning $4,000+ annually just on melted product.
But the real cost hides in the operational chaos. Every remake disrupts flow, adding 45-90 seconds to service time. During a rush, that backup compounds - one remake creates a line, stressed servers make more mistakes, melt rates climb higher. Shops where fixing melt problems improved average service time by 20%, allowing them to serve an extra 20-30 customers during peak periods.
The investment to fix most melt problems? Usually under $500. New door seals ($50-100), proper thermometers ($30-60), basic training time (3-4 hours of wages), and maybe some workflow adjustments that cost nothing. The fancy stuff - smart sensors, automated tracking, AI-powered analysis - makes sense once you're past 200 daily transactions, but the basics work for everyone.
Making corrections stick when staff doesn't care
Your team probably doesn't care as much as you do. To them, it's just another cone to remake, no big deal. This changes when you make melt rates visible and personal without being punitive.
Post daily melt percentages where everyone sees them. Not to shame anybody, but to create awareness. "Yesterday: 3.2% melt rate - nice work!" hits different than another lecture about waste. When rates improve, celebrate specifically: "Sarah's new cone technique cut our afternoon melt rate in half."
The shift experiment framework helps here too. When staff participate in testing solutions, they own the results. The person who discovered that pre-staging cups reduces melts becomes the natural champion for that procedure. Instead of forcing compliance, you're building investment.
Some shops tie melt rates to team rewards - not individual punishment but group benefits. Under 3% melt rate for the week? Everyone gets a free meal. It seems trivial, but it transforms melt prevention from annoying requirement to team challenge.
The path forward
Melt problems won't disappear completely. Ice cream melts - that's physics. But the difference between a 7% melt rate and a 2% rate is the difference between chaos and control, between profit and waste, between stressed servers and smooth operations.
Start with the basics: track everything for one week, identify your biggest problem category, run one focused experiment. Don't try to fix everything simultaneously. Pick soft-serve melt, or waffle cone breaks, or sundae remakes - not all three. Get one under control before moving to the next.
The shops that master this didn't find some secret technique. They just decided that melted product wasn't acceptable anymore and built simple systems to prevent it. Every saved serving drops straight to your bottom line. Every prevented remake speeds up service for the next customer. Every successful shift experiment builds team confidence that operations can actually improve.
Your melt problem is fixable. The question isn't whether you can reduce melted servings in your ice cream shop, but whether you'll commit to the boring, systematic work of tracking, testing, and adjusting until the problem stays solved. Most owners won't. The ones who do build the foundations for everything else - better service, happier customers, predictable profits, and operations that run smoothly even when you're not there watching every cone.
Your melt problem is fixable. The question isn't whether you can reduce melted servings in your ice cream shop, but whether you'll commit to the boring, systematic work of tracking, testing, and adjusting until the problem stays solved. Most owners won't. The ones who do build the foundations for everything else - better service, happier customers, predictable profits, and operations that run smoothly even when you're not there watching every cone.
Ready to scoop up efficiency and grow your shop?
Join hundreds of ice cream shops using Cremyly to boost productivity, reduce waste, and delight customers with faster service.