
Running an ice cream shop isn't just about seasonal swings or finding decent staff. It's watching your margins disappear between what you think you're making and what shows up in your account.
A shop owner in Austin showed me their books last month. On paper, they should've been clearing 18% margins. Reality? Barely 11%. The missing 7% wasn't one big problem—it was death by a thousand operational cuts. Overordering during slow periods. Staff giving extra scoops without tracking it. Promotions that looked great on Instagram but destroyed profitability.
Each leak was small. Together, they were sinking the business.
After building operational software for hundreds of food service businesses, the pattern becomes clear. The shops that survive aren't necessarily busier or making better ice cream. They're running tight operational rhythms that catch problems before they spiral. Not complicated systems—just consistent routines that connect inventory, scheduling, and daily performance.
Why ice cream shops hemorrhage margin (and don't realize it for weeks)
Ice cream operations look simple from outside. Buy product, schedule staff, serve customers. But underneath sits a coordination nightmare most shops never solve.
Your wholesale costs fluctuate but your POS system doesn't update automatically. You're still pricing that specialty flavor at last month's margin while paying 15% more for ingredients. Tuesday afternoon has three people standing around while Saturday night runs skeleton crew during rush. The new employee thinks "generous portions" means filling cups to the brim.
Most shops only reconcile these issues monthly, if at all. By the time you realize last week's promotion torched your margins, you've already repeated the mistake three times. When you discover the scheduling imbalance, you've burned weeks of unnecessary labor costs.
Traditional restaurant management assumes predictable patterns. Same menu, similar costs, consistent traffic. Ice cream shops face wild variability. Weather swings can double or halve daily traffic. Seasonal flavors mean constantly shifting costs. Tourist seasons create staffing chaos.
The difference between profitable shops and struggling ones isn't complicated. It's running daily rhythms that surface problems early.
The three-tier cadence that actually works
Forget complicated management frameworks. You need three operational rhythms: daily verification, weekly calibration, monthly analysis. Each tier catches different problems before they snowball.
Keep your ice cream shop running smoothly.
Cremyly helps you manage every order, stock level, and staff shift with precision and ease.
- Real-time inventory tracking
- Order management dashboard
- Staff scheduling & shift coordination
No credit card required
Daily: The 15-minute margin check
-
Yesterday's actual sales vs labor hours worked
-
Current inventory levels for top 5 sellers
-
Today's scheduled labor vs expected traffic
This isn't deep analysis. You're looking for obvious red flags. Did yesterday's slow afternoon still have full staffing? Are you about to run out of vanilla before the weekend? Is today overstaffed based on weather forecasts?
The key metric here is dollars per labor hour. Not perfect, but catches 80% of scheduling problems. Anything below $85/hour during peak season or $65/hour off-season triggers immediate schedule adjustments.
Weekly: The coordination checkpoint
-
Last week's purchase orders against actual usage
-
Promotional performance vs regular pricing periods
-
Staff hours scheduled vs actually worked
-
Waste logs and comp records
This is where patterns emerge. Maybe Tuesday deliveries consistently over-order because nobody updated pars after summer ended. Perhaps that "buy-one-get-one" promotion on Wednesdays attracts customers but destroys margins because people only buy during promotions now.
The weekly checkpoint prevents small problems from becoming institutional. That generous new employee gets retrained before they've given away hundreds in extra product.
Monthly: The full reconciliation
-
Which promotions actually drove profitable traffic vs margin killers
-
Whether staffing patterns matched actual demand curves
-
How inventory turns compared to waste and stockouts
-
Where process breakdowns repeatedly cost money
This deeper analysis feeds back into daily and weekly rhythms. Maybe you discover afternoon shifts can run with one less person. Perhaps certain promotions work great for clearing old inventory but terrible for driving new business.
The point isn't to constantly break rules. It's to break them consciously, with clear reasoning, and track the results separately from standard operations. Smart exceptions prove you understand the system rather than just following it blindly.
Quick visual of the three-tier cadence workflow:
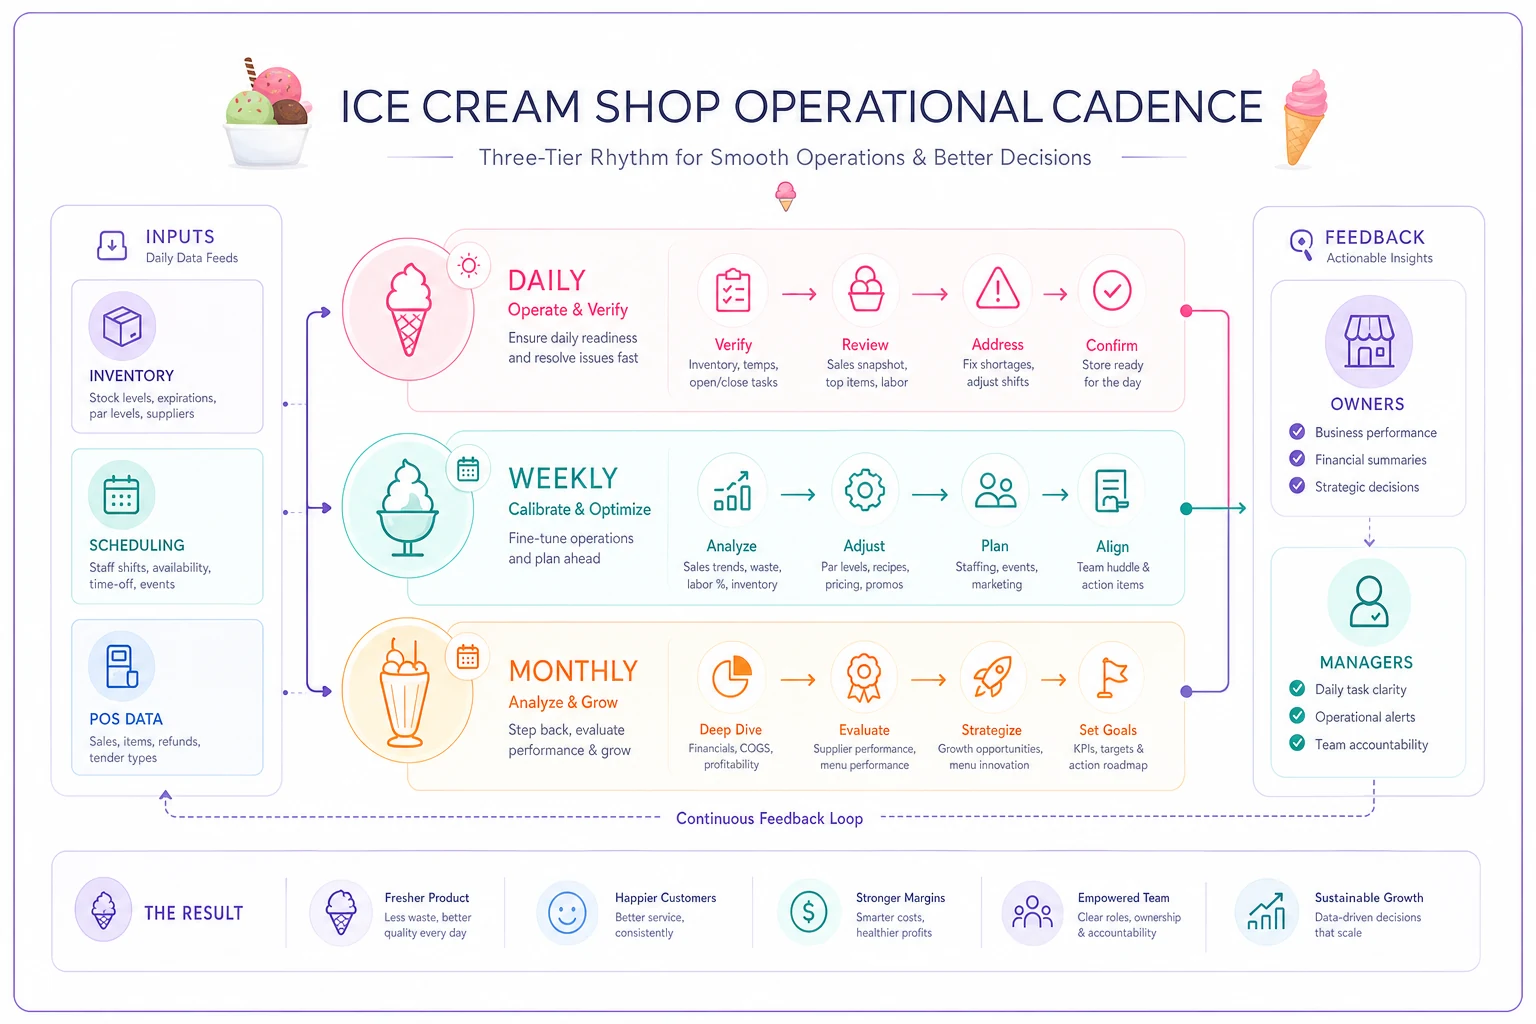
This visualization shows how daily checks feed weekly calibration which then informs monthly analysis, with feedback loops to adjust inventory, scheduling, and promotions.
Building your margin control dashboard
Numbers without context are useless. You need a simple dashboard that connects operations to financial performance. Focus on metrics that actually matter:
| Metric | Daily Target | Weekly Target | Red Flag |
|---|---|---|---|
| $/Labor Hour | $75-95 (season adjusted) | Average >$82 | Below $65 any day |
| Inventory Turns | N/A | 2.5-3x for top flavors | Below 2x or above 4x |
| Waste % | <2% of sales | <1.5% weekly avg | Above 3% any day |
| Promotion Impact | Track participation | Margin hit <2% | Margin hit >4% |
| Labor % of Sales | 25-30% | 27% average | Above 35% any day |
Raw metrics don't tell the whole story though. You need cross-checks that connect different parts of the operation.
Inventory-to-Sales Reconciliation:
If you sold 50 gallons worth of ice cream but inventory only shows 45 gallons used, you've got a problem. Either portions are off, waste isn't being logged, or someone's taking product home.
Schedule-to-Traffic Verification:
Compare scheduled hours to actual customer counts. Most POS systems track transaction counts by hour. If you're scheduling based on "feels busy" instead of actual data, you're guaranteed to be overstaffed.
Promotion-to-Baseline Analysis:
Track not just promotion performance, but what happens to regular sales. If your Sunday special drives traffic but Monday-Tuesday die because everyone waits for deals, you're training customers to avoid full price.
Use the dashboard to cross-check these signals daily so small mismatches surface quickly.
Common failure points as you scale
The operational cadence that works at $30k monthly revenue breaks around $50k. The one that works at $50k falls apart approaching $100k. Each growth stage introduces complexity your systems must evolve to handle.
The $30-50k transition: From owner-operated to delegated
When you're doing $30k monthly, the owner touches everything. They know intuitively when inventory feels off or staffing seems heavy. But approaching $50k, you need shift supervisors making decisions. Suddenly your "I just know" system needs documentation.
Most shops stumble here. They implement systems but don't verify execution. The morning checklist exists but nobody actually runs the numbers. Waste gets "logged" but the sheets disappear. Schedules get "optimized" but managers add people back because it feels too light.
The fix isn't more complex systems—it's building verification into the routine. Every checklist needs completion confirmation. Every log sheet gets photographed and uploaded. Every schedule adjustment requires documenting why.
The $50-100k evolution: Multiple revenue streams collide
Bigger shops aren't just selling scoops. They're running catering, selling pints retail, maybe wholesaling to local restaurants. Each revenue stream has different margin profiles and operational requirements.
Your simple dashboard can't handle this complexity. Catering might show 40% margins but requires dedicated prep labor. Wholesale moves volume but at 15% margins. Retail pints look profitable until you factor in the freezer space they monopolize.
The operational cadence must evolve to track margin by channel, not just total margin. Otherwise, you'll chase revenue growth in areas that actually hurt profitability.
When to break your own rules
Rigid systems eventually become straightjackets. The best operations know when to deviate from the playbook intelligently.
Promotional flexibility:
That social media influencer wants to film at your shop? The normal promotional analysis says spending $200 in free product for "exposure" is terrible ROI. But if they have 50k local followers and you're trying to build awareness, it might make sense. Track these exceptions separately—don't let them skew your regular metrics.
Staffing surge decisions:
Your standard says run with two people on Tuesday afternoons. But there's a heat wave and the weather app shows 95°F. Add the extra person. The per-hour labor metric will look bad, but stockouts and horrible service hurt worse than one day of higher labor costs.
Inventory gambles:
A supplier offers 30% off if you triple your normal order. Your turnover metrics scream no. But if you have freezer space and cash flow allows, the margin improvement might justify breaking your inventory rules. Just track it separately so three months later you remember why inventory spiked.
The point isn't to constantly break rules. It's to break them consciously, with clear reasoning, and track the results separately from standard operations. Smart exceptions prove you understand the system rather than just following it blindly.
Technology's role (without the hype)
You don't need AI to run basic operational cadences. Spreadsheets and discipline beat fancy software with poor execution every time. But the right technology makes consistency dramatically easier.
Modern operational platforms can automatically pull your POS data, compare it to scheduled labor, and flag unusual patterns before you even walk in. Instead of manually calculating dollars per labor hour each morning, you get an alert when it drops below threshold. Rather than remembering to check inventory pars weekly, the system notices when turnover rates drift from normal.
The valuable part isn't the automation itself—it's that technology removes friction from maintaining disciplined operations. When checking metrics takes 30 seconds instead of 15 minutes, it actually happens daily. When reports generate automatically, weekly reviews don't get skipped during busy periods.
Some shops have built AI-assisted operational platforms that predict tomorrow's traffic based on weather, local events, and historical patterns. Nothing magic—just pattern recognition that helps you staff appropriately. Others use basic automation to flag when promotional pricing cuts too deep into margins, saving them from repeating expensive mistakes.
Technology should enforce your operational cadence, not replace it. The shops that fail with new software expect it to solve problems automatically. The ones that succeed use it to run their existing playbook more consistently.
Making this actually stick
Every ice cream shop owner reading this has tried implementing systems before. The challenge isn't knowing what to do—it's maintaining discipline when summer gets crazy or winter gets slow.
Start with just the daily check. Don't implement all three tiers at once. For two weeks, every single morning, someone calculates yesterday's dollars per labor hour and compares inventory on your top three flavors to expected sales. That's it. No weekly reviews, no monthly analysis, just this one rhythm until it becomes automatic.
Rotate the daily check owner weekly to keep accountability high and avoid checklist fatigue.
Once the daily check is habitual, add the weekly coordination. Don't perfect it—just start it. Even a messy weekly review beats no review. After a month of weekly touchpoints, layer in the monthly reconciliation.
The progression matters because habits compound. The daily check creates awareness that makes weekly reviews more meaningful. Weekly patterns make monthly analysis actually actionable instead of just depressing.
Most importantly, assign ownership. "Everyone's responsible" means nobody does it. Pick one person for the daily check. Rotate if needed, but someone specific owns each day. Weekly reviews need a consistent owner—probably you or a manager. Monthly analysis stays with ownership or senior management.
The compound effect builds slowly, then suddenly. You won't notice it day to day, but six months from now you'll catch problems in days instead of weeks.
The compound effect of operational discipline
Six months from now, you won't remember the specific day you started running daily margin checks. But you'll notice you're not scrambling to figure out why last month's P&L looks wrong. You'll catch that new employee's overportioning habit in three days instead of three weeks. You'll know exactly which promotions drive profitable growth versus just traffic.
The shops that survive long-term aren't running complex systems. They're running simple systems consistently. They catch small problems before they compound. They make decisions based on data they trust because they verify it constantly.
Your operations playbook doesn't need to be perfect. It needs to be consistent, verified, and evolve with your business. Start with the daily check tomorrow morning. Build from there. In six months, you'll wonder how you ever operated without it.
The margin leaks won't stop completely. But they'll shrink from rivers to drips, and you'll catch them before they flood your bottom line.
Ready to scoop up efficiency and grow your shop?
Join hundreds of ice cream shops using Cremyly to boost productivity, reduce waste, and delight customers with faster service.