



Most scoop shop owners don't skip their weekly numbers because they're lazy. They skip them because the numbers live in six places — the POS export, supplier invoices in a shoebox, the schedule in some app, a waste sheet taped to the walk‑in door — and pulling it all together takes an hour before you've actually learned anything. By the time you have an answer, the week is gone and so is the margin.
This is a build‑it‑once fix. One tab, four input blocks, every formula sitting right next to the number it produces, and a reconciliation checklist you only run when something looks wrong. The goal isn't a pretty dashboard. It's a drill you can finish Monday morning with a coffee and still have time to text a supplier before noon.
If you've already read the compact weekly P&L drill checklist for scoop shops, this is the companion build — the actual sheet you paste in, plus the escalation table that tells you who owns a red flag and how fast they need to act.
The four blocks that belong on the page (and nothing else)
The mistake with most owner‑built P&L sheets is scope creep. Someone adds a tab for tips, another for credit card fees, another for a loyalty program nobody actually tracks anymore. Six months later the file is untouchable and you're back to gut feel.
A weekly drill only needs four input blocks because those are the four numbers that actually move week‑to‑week in a scoop shop:
-
Net Sales — what you actually kept after discounts, comps, and refunds
-
COGS — opening inventory + purchases − closing inventory
-
Labor — total wages for the week, including the owner if you pay yourself an hourly equivalent
-
Waste — melt, rejects, dropped scoops, expired tubs, over‑pour on samples
Count inventory at the same time each week (same day/time) to avoid routine timing errors between deliveries and counts.
Everything else — rent, insurance, equipment leases — is a fixed monthly line. It doesn't belong in a weekly drill because you can't change it on a Monday. The weekly numbers are the ones you can actually act on.
The copy‑paste CSV template
Paste this directly into a Google Sheet (File → Import → paste, or just drop it into A1 and use "Split text to columns" on the comma). Column A is the label, column B is where you type the raw input, column C holds the formula or the result.
Keep your ice cream shop running smoothly.
Cremyly helps you manage every order, stock level, and staff shift with precision and ease.
- Real-time inventory tracking
- Order management dashboard
- Staff scheduling & shift coordination
No credit card required
Section,Input / Label,Value or Formula WEEK,Week ending,2024-07-14 WEEK,Days open this week,7 ,, NET SALES,Gross sales (POS),18450 NET SALES,Discounts & promos,-640 NET SALES,Comps & voids,-210 NET SALES,Refunds,-95 NET SALES,Net Sales,=B4+B5+B6+B7 ,, COGS,Opening inventory (Mon AM),7200 COGS,Purchases this week,4350 COGS,Closing inventory (Sun PM),6900 COGS,COGS,=B10+B11-B12 COGS,COGS % of Net Sales,=C13/C8 ,, LABOR,Front-of-house wages,3100 LABOR,Back-of-house / prep wages,1150 LABOR,Manager / owner draw (hourly equiv),900 LABOR,Payroll tax & burden (est %),0.12 LABOR,Total Labor,=(B17+B18+B19)*(1+B20) LABOR,Labor % of Net Sales,=C21/C8 ,, WASTE,Melt & dropped (est $ cost),180 WASTE,Expired / tossed tubs ($ cost),240 WASTE,Sample over-pour ($ cost),95 WASTE,Total Waste,=B25+B26+B27 WASTE,Waste % of Net Sales,=C28/C8 ,, PRIME COST,Prime Cost ($),=C13+C21 PRIME COST,Prime Cost % of Net Sales,=C31/C8 PRIME COST,Contribution after prime ($),=C8-C31
A few notes on the sample numbers. The gross sales figure ($18,450) is a mid‑summer week for a single‑location shop doing somewhere between $750k and $900k a year. Discounts run a little high at $640 because this sample week had a two‑for‑one promo running — which is exactly the kind of thing that should show up in the data and not quietly distort your margins.
The payroll burden line (0.12) is a placeholder. Real burden — employer payroll taxes, workers' comp, any benefits — usually lands between 10% and 18% depending on your state. Pull your actual number once from your payroll provider and leave it. It doesn't change week to week.
Every KPI formula in one place
Here's the reference table. These are the only ratios you need for a weekly drill.
| KPI | Formula | What it tells you |
|---|---|---|
| Net Sales | Gross − Discounts − Comps − Refunds | Real revenue, not register total |
| COGS | Opening Inv + Purchases − Closing Inv | True cost of product sold this week |
| COGS % | COGS ÷ Net Sales | Product cost efficiency |
| Total Labor | (Wages sum) × (1 + burden %) | Fully‑loaded people cost |
| Labor % | Total Labor ÷ Net Sales | Staffing efficiency |
| Waste % | Total Waste ÷ Net Sales | Loss from melt, expiry, over‑pour |
| Prime Cost | COGS + Total Labor | The two numbers you control most |
| Prime Cost % | Prime Cost ÷ Net Sales | Your single best health number |
Prime cost is the one to watch. For a scoop shop, healthy prime cost usually sits somewhere in the low‑to‑mid 50s as a percent of net sales — roughly 55–60% depending on whether you make your own base or buy it finished. If prime cost drifts past the low 60s for more than two consecutive weeks, you're not making the margin you think you are, even if the register looks busy.
Prime cost is the single best health number for the shop; watch it weekly and act when it trends into amber or red.
Exactly which exports to pull
The weekly drill breaks down most often at the data‑gathering step. Here's the pull list, in the order that tends to be fastest.
-
POS weekly sales summary — Export Mon–Sun. You want gross sales, discount total, void/comp total, and refund total as separate lines. Square, Toast, and Clover all have a "Sales Summary" or "Sales Trends" report that breaks these out. Don't eyeball the dashboard tile — export the actual report so comps and refunds don't hide inside net.
-
Supplier invoices for the week — Dated receipts for dairy, mix, cones, toppings, packaging. Sum them for the Purchases line. Use delivery dates, not order dates.
-
Opening and closing inventory counts — Two physical counts, Monday open and Sunday close, valued at cost. This is the step people skip, and it's the one that makes COGS real instead of a guess.
-
Payroll / scheduling export — Total hours × rates for the week, split front‑of‑house and prep if you can. Most scheduling tools export a labor cost summary.
-
Waste log — Shift waste sheet, converted to dollar cost. If you don't log waste yet, start with a clipboard. Even a rough tally beats a zero everyone knows is a lie.
The whole pull should take under ten minutes once you've done it a few times. The inventory count is the long pole — budget about five minutes for a focused count of your freezer and dry storage.
The reconciliation checklist (run only on a red flag)
You don't reconcile every week. You reconcile when a number trips a threshold.
Running the full checklist every single week is how people burn out on the drill within a month — save the deep dig for when the sheet actually flags something.
-
[ ] Does Net Sales match your bank deposit for the week (± card settlement timing)?
-
[ ] Do summed supplier invoices match what actually came through the back door? Check for a delivery you logged but didn't receive, or vice versa.
-
[ ] Was the closing inventory counted at the same depth as opening? (Half a tub counted as full throws COGS more than people expect.)
-
[ ] Did a promo run that inflated discounts? Confirm against the POS promo report.
-
[ ] Are there voids clustered on one shift or one employee?
-
[ ] Does the labor export include a shift someone forgot to clock out of?
-
[ ] Is waste logged in cost, not retail? A dropped double scoop is maybe $0.90 in product, not the $6.50 you'd have sold it for.
Only run this checklist when the sheet flags something — it should be an escalation, not the default Monday routine.
Worked example: when COGS % spikes and you reconcile it
Numbers alone don't help much — the stepwise math of actually tracing a red flag is what makes this template useful in practice.
-
Net Sales
$17,900
-
Opening inventory
$7,200
-
Purchases
$5,950
-
Closing inventory
$6,100
COGS = 7,200 + 5,950 − 6,100 = $7,050 COGS % = 7,050 ÷ 17,900 = 39.4% Your normal COGS % runs around 30–32%. So 39% is a loud red flag. Here's the reconciliation walk, step by step:
[GRAPH: COGS % Reconciliation Walk — from red flag to corrected figure] Step 1: Check purchases abnormality → Purchases jumped from ~$4,200 to $5,950 (+$1,750) → Found: $1,600 dairy delivery landed Sunday afternoon (post-selling) Step 2: Verify closing inventory captured the delivery → Closing count: $6,100 (lower than $7,200 opening) → Sunday delivery ($1,600) was NOT included in closing count Step 3: Correct the closing count → Corrected closing = $6,100 + $1,600 = $7,700 Step 4: Recompute COGS → COGS = $7,200 + $5,950 − $7,700 = $5,450 → COGS % = $5,450 ÷ $17,900 = 30.4% ✓
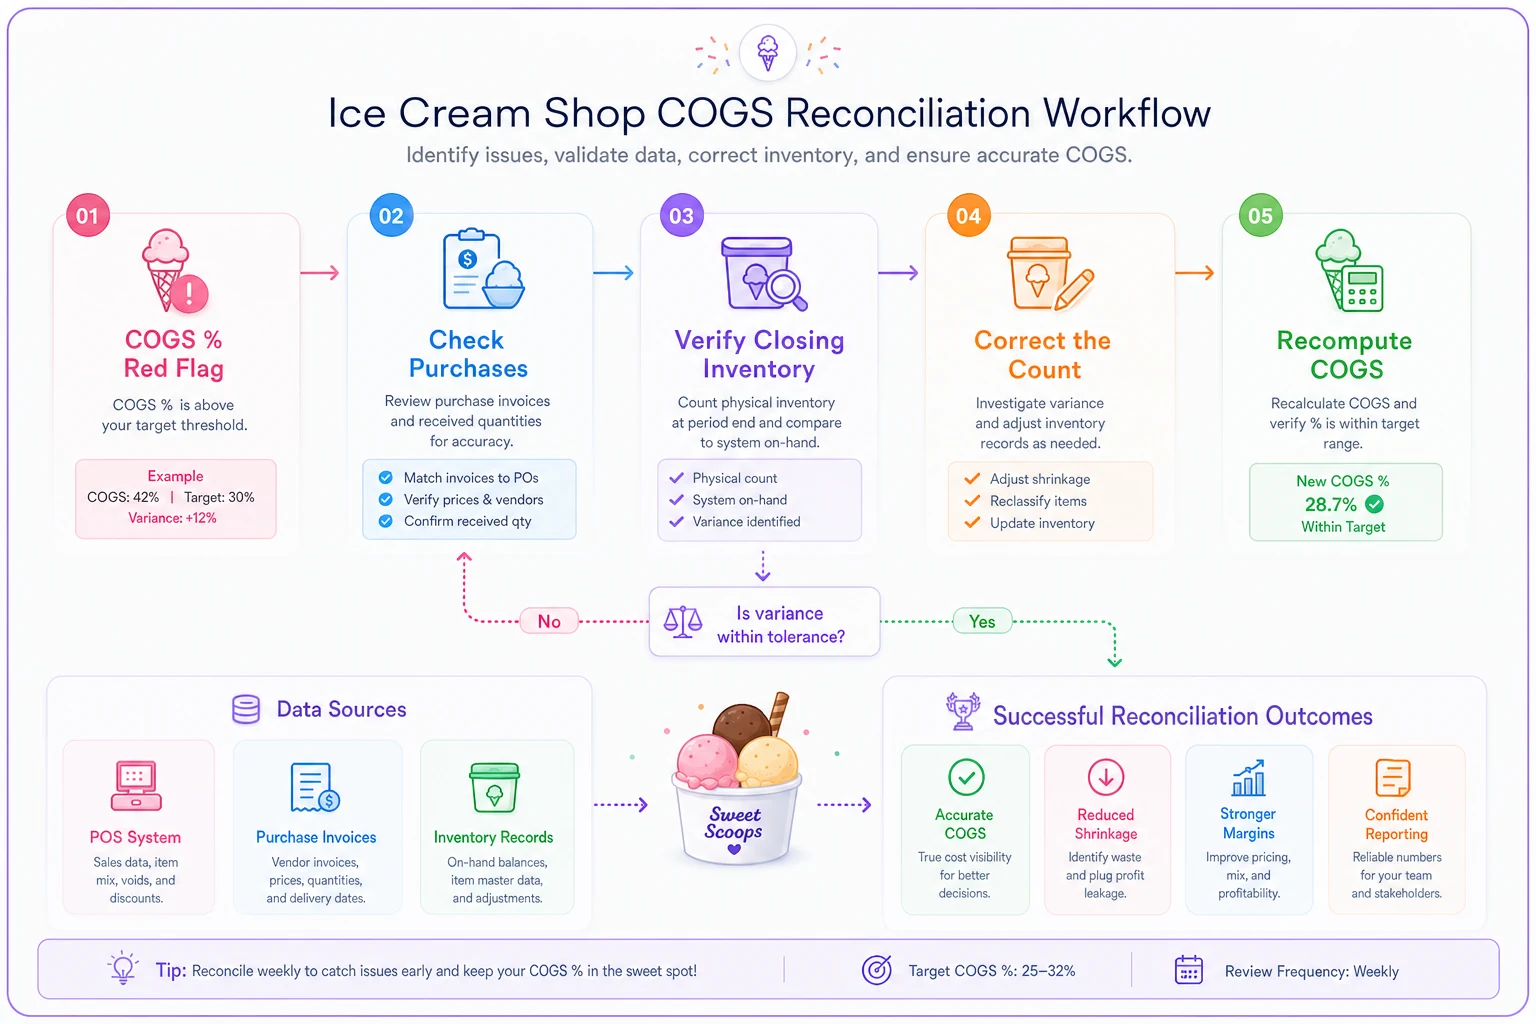
Here's the short walk visualized: purchases → inventory check → correction → recompute.
Step 1 — Is purchases abnormal? Purchases jumped to $5,950 from a typical $4,200. That's +$1,750. Pull the invoices. You find a dairy delivery of $1,600 that landed Sunday afternoon — after most of the week's selling. That product is sitting in the freezer right now.
Step 2 — Did closing inventory capture it? Check the closing count. Closing came in at $6,100, which is lower than opening's $7,200. If you took in $1,600 of fresh dairy Sunday, closing inventory should have climbed, not dropped. That's the tell: the Sunday delivery wasn't counted in the closing number.
Step 3 — Correct the count. Add the $1,600 that was physically there but uncounted. Corrected closing = 6,100 + 1,600 = $7,700.
Step 4 — Recompute. COGS = 7,200 + 5,950 − 7,700 = $5,450. COGS % = 5,450 ÷ 17,900 = 30.4%.
The spike wasn't theft or a portioning problem. It was a counting problem — a late delivery that hit purchases but never made it into the closing count, which artificially inflated COGS by about 9 points. That's the most common false alarm in a weekly drill, and the fix is free.
A COGS spike has three usual suspects, in order of likelihood: (1) a count timing error like the one above, (2) a purchase that genuinely over‑stocked you, or (3) real shrink from over‑portioning or waste. Clear the count error first. It's the answer more often than you'd expect.
Calibrating your red / amber thresholds
Generic benchmarks are a trap. A shop that buys finished pints has a completely different COGS % than one making base from scratch. Calibrate to your own history, not some industry average you found on a blog.
-
Run the drill for six to eight normal weeks — no freak heat wave, no broken freezer, no grand‑opening promo.
-
For each KPI, take the average and the rough spread across those weeks.
-
Set amber at roughly one normal week's worth of drift above average — about where you'd raise an eyebrow.
-
Set red at the point where two weeks in a row would seriously dent the month.
A worked version for a shop whose COGS % averages 31%, with normal weeks bouncing between 29% and 33%:
| KPI | Green | Amber | Red |
|---|---|---|---|
| COGS % | ≤ 33% | 33–36% | > 36% |
| Labor % | ≤ 30% | 30–34% | > 34% |
| Waste % | ≤ 3% | 3–5% | > 5% |
| Prime Cost % | ≤ 60% | 60–64% | > 64% |
Revisit these every season. Summer labor % runs higher because you're staffing for peak; winter COGS % can creep because volume drops but minimum orders don't. Thresholds that never get updated will either cry wolf all winter or stay quiet through a real summer problem.
Escalation SLA and owner table
A flag nobody owns is a flag nobody fixes. In a lot of shops, the owner spots the problem, mentions it in passing, and everyone forgets by Wednesday. Put a name on it, set a deadline, move on.
| Flag | Owner | Response time | Required action |
|---|---|---|---|
| COGS % amber | Shift lead | Within 48 hrs | Verify closing count + delivery timing; log finding |
| COGS % red | Owner/GM | Within 24 hrs | Full reconciliation walk; check portioning + invoices |
| Labor % amber | Scheduler | Before next schedule posts | Trim one slow‑period shift or adjust overlap |
| Labor % red | Owner/GM | Within 48 hrs | Review schedule vs. actual sales by daypart |
| Waste % red | Prep lead | Within 24 hrs | Pull waste log; identify top waste line; corrective note |
| Net Sales vs. deposit mismatch | Owner/GM | Same day | Bank + POS settlement check; flag possible shrink |
The time boxes matter more than they look. "Within 48 hours" means there's a clock and a required action — not a note that sits in someone's head until it doesn't. Keep a one‑line log of what each flag turned out to be. After a couple of months that log becomes the most useful document in the shop, because it shows you which flags are real recurring problems and which are the same false alarm every single time.
When this drill is worth it — and when it isn't
When it makes sense: You're doing enough volume that a few points of COGS or labor is real money — roughly $400k a year and up. You have at least one other person who touches ordering or scheduling, so coordination errors are possible. You've had a month where the register looked fine but the bank account didn't.
When it's overkill: You're a seasonal popup or a very small operation where you personally buy every tub and work every shift. At that scale you already know your numbers by feel, and a formal weekly drill adds process without adding much insight. Run it monthly instead.
One honest note on inventory: if you genuinely can't commit to counting inventory twice a week, don't bother building the COGS block. A COGS line without real inventory counts is a number that lies to you — and a lying number is worse than no number because you'll actually trust it.
A real scenario
A two‑owner shop doing around $780k a year kept seeing decent weeks on the POS but ending the summer with less cash than the prior year. They weren't tracking waste in dollars at all, and inventory was counted whenever it felt convenient, which in practice meant not consistently.
They built the one‑page drill and committed to the Monday count. The first three weeks were messy — thresholds were guesses and half the flags were count errors exactly like the worked example above. By week five the false alarms dropped off and a real pattern showed up: waste % was consistently running close to 6%, driven almost entirely by end‑of‑night melt from a display case they overfilled every afternoon.
The fix was unglamorous. Fill the display case to about two‑thirds capacity in the last two hours before close. Waste % settled back under 3.5% within a few weeks, which on their volume worked out to a few thousand dollars recovered over the back half of the season. Not a dramatic turnaround — just a number that was finally visible, owned, and acted on inside 48 hours instead of discovered in October.
The point
A weekly P&L drill template isn't about having more spreadsheets. It's about collapsing the time between "something's off" and "I know what it is and who's fixing it" down to a single Monday morning. The sheet above does that with four input blocks, eight formulas, a reconciliation walk you only run when a threshold trips, and an owner table so no flag dies in the hallway.
Build it once this week using your own numbers. Run it for two months before you judge whether it's working — the first few weeks will be noisy while you clean up count timing and calibrate thresholds. After that, the drill mostly tells you one of two things: everything's green, close the tab, go make ice cream — or here's exactly where the money leaked, and here's who's on it by Wednesday. Either answer is worth twenty minutes.
Build it once this week using your own numbers. Run it for two months before you judge whether it's working — the first few weeks will be noisy while you clean up count timing and calibrate thresholds. After that, the drill mostly tells you one of two things: everything's green, close the tab, go make ice cream — or here's exactly where the money leaked, and here's who's on it by Wednesday. Either answer is worth twenty minutes.
Ready to scoop up efficiency and grow your shop?
Join hundreds of ice cream shops using Cremyly to boost productivity, reduce waste, and delight customers with faster service.