
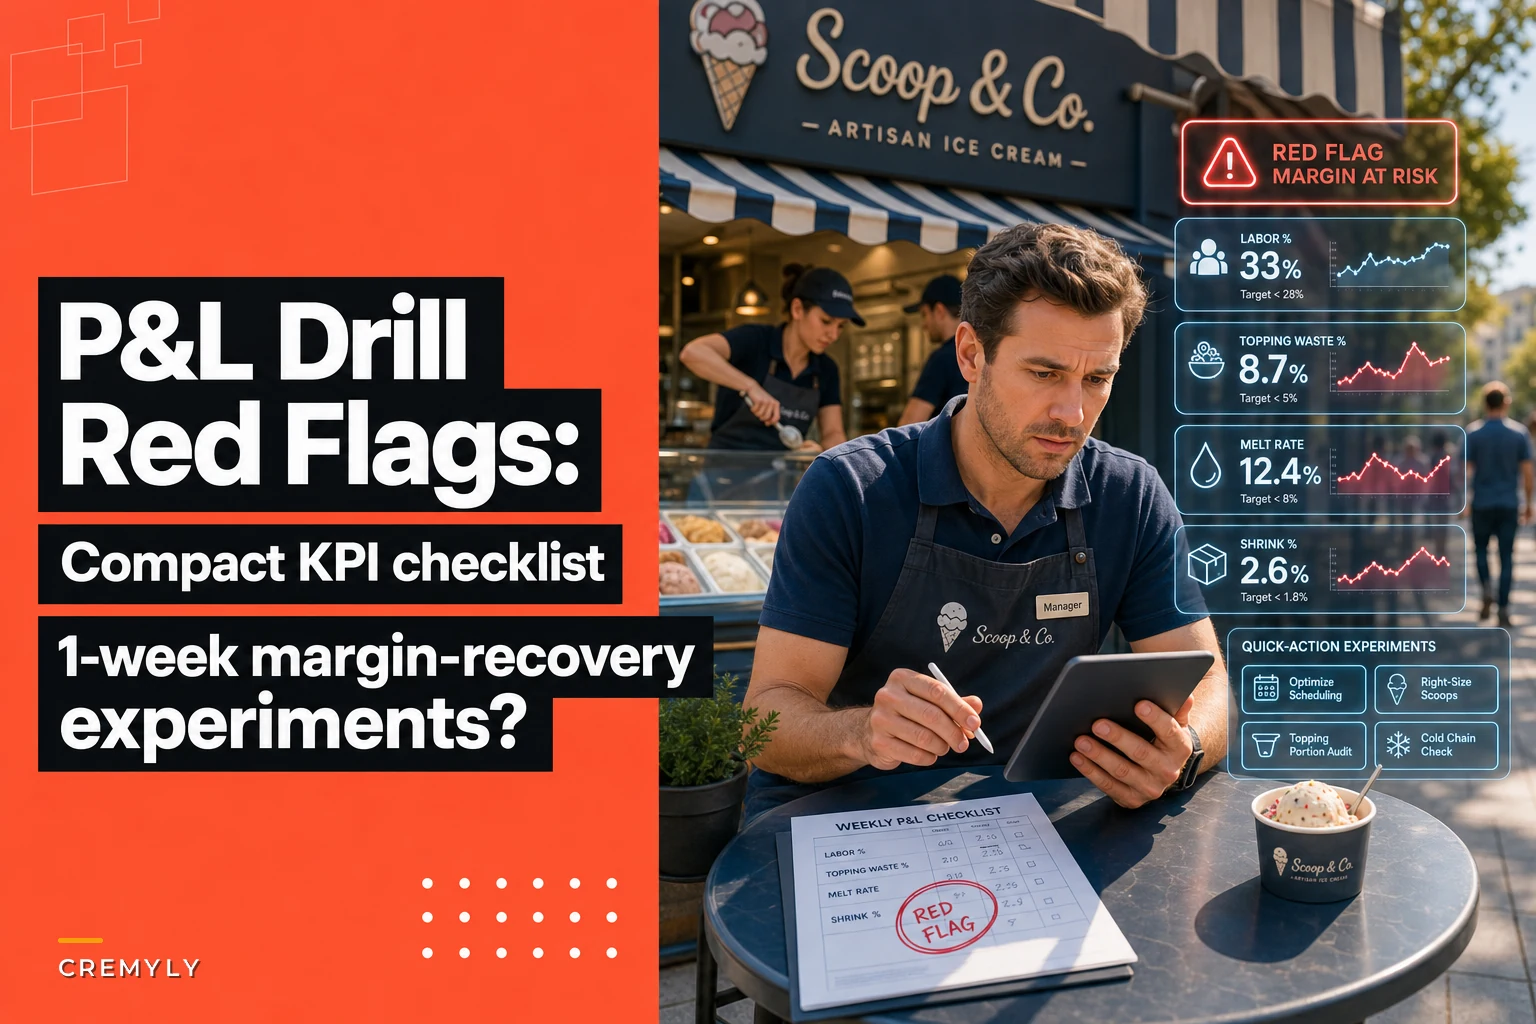

Most scoop shop owners look at their P&L once a month, usually when the accountant sends it over, and by then the damage is already baked in. If your labor ran hot in week two and your topping station was leaking product all month, you're finding out about a $1,800 problem four weeks after it started. Four weeks you can't get back.
The fix isn't more accounting. It's a tight weekly read on four numbers, plus knowing exactly which threshold means "stop what you're doing and fix this now." This is the weekly P&L drill for an ice cream shop — small enough to run in fifteen minutes, specific enough to actually change what happens on the floor.
The four numbers that decide whether your week was profitable
You don't need a dashboard with forty metrics. For a scoop shop, four numbers explain the vast majority of margin swings week to week:
-
Labor % — total labor cost (including payroll tax and any bonuses) divided by net sales
-
Topping / mix-in waste % — cost of toppings and mix-ins wasted or over-portioned, as a share of topping revenue
-
Melt rate — product lost to melt, refreeze rejection, and thaw damage, as a % of product cost
-
Shrink — the gap between what your system says you should have and what you actually have (theft, giveaways, mis-rings, spoilage not otherwise tracked)
Everything else — rent, utilities, insurance — is mostly fixed week to week. These four move because of decisions your team makes during a shift. That's what makes them worth checking weekly instead of monthly.
One pattern worth noticing: shops that struggle almost never have all four out of range at the same time. Usually it's one or two, and they mask each other. A great labor week hides a terrible waste week when you're only looking at the bottom line. Checking them separately is the whole point.
Red-flag thresholds: what "normal" and "call it now" actually look like
The thresholds below hold up across a wide range of scoop shops. Your exact targets depend on your pricing and menu mix — if you haven't nailed down your per-scoop cost yet, that's step zero, and the walkthrough in Pricing by portion is the place to start.
Keep your ice cream shop running smoothly.
Cremyly helps you manage every order, stock level, and staff shift with precision and ease.
- Real-time inventory tracking
- Order management dashboard
- Staff scheduling & shift coordination
No credit card required
| KPI | Healthy range | Watch zone | Red flag — act this week |
|---|---|---|---|
| Labor % | 22–28% | 29–32% | 33%+ |
| Topping / mix-in waste % | 2–4% | 5–7% | 8%+ |
| Melt rate | under 3% of product cost | 3–5% | 6%+ |
| Shrink | under 1.5% | 1.5–3% | 3%+ |
The watch zone isn't an alarm — it's a nudge to look closer next week. The red flag column is different. That's a number that, left alone for a month, quietly eats an entire week of profit. On a shop doing $12k–$15k a week, labor sitting at 34% instead of 27% is close to $1,000 gone in a single week. Nobody notices it on a busy Saturday. Everybody notices it at year-end.
The most common mistake isn't missing the threshold — it's setting it too loose because "we've always run around 32% labor." Anchoring to your own bad habit isn't a benchmark.
The 15-minute Sunday drill
Run this before you build next week's schedule, because two of the four numbers directly affect how you'll staff.
-
Pull net sales for the week. Not gross, not including tax. This is the denominator for everything else, so get it clean first.
-
Total labor cost, including the hidden pieces. Payroll tax, shift bonuses, the hour you paid someone to come in early for a delivery. Divide by net sales. Write down the %.
-
Weigh your topping waste. This one people skip because it feels fuzzy. It isn't — put a small container by the topping station Monday and have staff toss over-portioned or dropped mix-ins into it. Weigh it Sunday, cost it out roughly, compare to topping revenue.
-
Count melt and reject losses. Any tub pulled for freezer-burn, any product that got soft during a case failure and got tossed, any refreeze you rejected. You should already be logging these if you've tightened your perishable handling.
-
Reconcile shrink. What your inventory system says you had minus what you physically counted, minus what you legitimately sold. The leftover gap is shrink.
-
Circle anything in the red-flag column. Pick the single worst one. Don't try to fix all four at once — you'll fix none.
-
Design one corrective experiment for that number. More on this below.
The reason this works is sequencing. You're reading the numbers before you commit next week's schedule and orders, so the corrective move lands in the coming week instead of the one after.
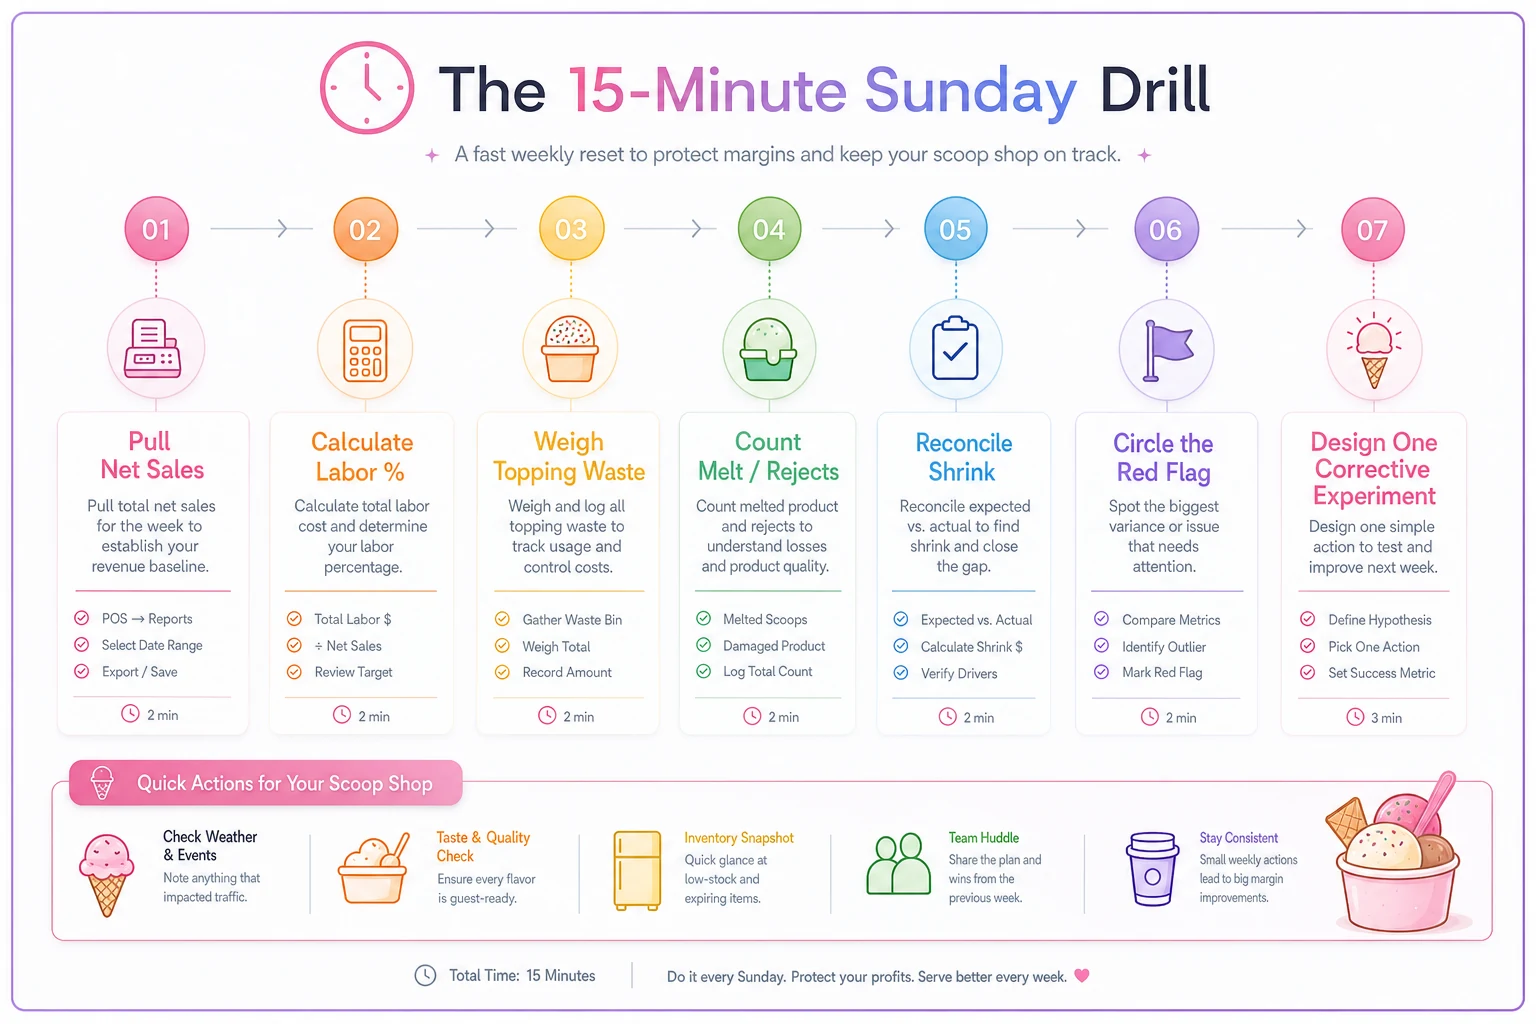
A simple visual of the 15-minute drill workflow to follow.
Quick corrective experiments (pick one, run it for a week)
Your fix window is one week, so the experiments have to be small enough to run and measure in seven days. Here's what actually moves each number:
If labor % is red:
-
Cut one hour off the open or close where you consistently see zero customers. Most shops overstaff the first 45 minutes.
-
Move your second scooper's start time to match your actual traffic curve, not the "we open at noon so everyone starts at noon" default.
If topping waste is red:
-
Switch to a fixed-portion scoop or spoon for the two most-wasted toppings — usually the expensive ones like chopped candy or premium sauces.
-
Run a one-week "call the portion" check where a manager spot-watches ten builds a shift. Waste drops fast when people know someone's paying attention, and often the correction sticks.
If melt rate is red:
-
Check case temps at three set times a day instead of "whenever." Most melt loss traces back to a case running two degrees warm at peak, not a dramatic failure.
-
Reduce how much backup product you pull to the front line during slow shifts. Product sitting in a display case degrades faster than product in deep storage.
If shrink is red:
-
Move to a manager-only comp/void code for one week and watch whether "free scoop for a friend" was quietly eating your margin.
-
Recount your top three most expensive SKUs mid-week, not just end of week — you'll narrow down which day the gap opens.
These are all cheap and reversible. That's the filter. If a fix requires new equipment or a hard conversation with your landlord, it's a project, not a weekly experiment.
A worked example: recovering margin in one week
A single-location shop doing about $13,400 in net sales runs the Sunday drill. The numbers:
-
Labor
$3,750 → 28% — top of healthy, fine
-
Topping waste
about 4% — fine
-
Melt rate
3.5% — watch zone, noted
-
Shrink
3.4% — red flag
Shrink is the one. Their inventory system said they should've had roughly $410 more product than the physical count showed, on top of normal sold-through.
The corrective experiment: manager-only void codes and a mid-week recount of the three priciest tubs. Cost to run: zero.
By Wednesday's recount, the manager spots that the gap is almost entirely in one premium flavor — and it's opening on the two evening shifts a particular staffer closes. Not theft, as it turned out: over-scooping. That person was building "single" scoops closer to doubles, consistently, because nobody had ever shown them the portion weight.
One five-minute demo with a scale on the line. Recount the following Sunday: shrink back down to 1.6%, roughly $360 of the $410 gap recovered. Annualized, that one closer's over-scooping was worth close to $18k in lost product. Found and closed in a week, for the price of paying attention to the right number.
That's the whole value of the drill. The problem wasn't dramatic — it was a drip that a monthly P&L would have averaged into invisibility.
When this drill makes sense — and when it doesn't
When it makes sense: you're doing enough volume that a couple of points of margin is real money (roughly $8k+ a week), and your numbers swing week to week for reasons you can't quite explain. If your P&L feels like a surprise every month, this is for you.
When it's overkill: a tiny seasonal stand doing a few hundred dollars a day with two staff and one freezer doesn't need four KPIs. A quick end-of-week labor check and a waste weigh is plenty.
Who should not run this as-is: if you haven't gotten your inventory counts and portion costs reliable yet, the drill will just produce noisy numbers you can't trust. Get the foundation right first — the alignment work in the margin leaks playbook is the prerequisite. Garbage counts in, garbage KPIs out.
Where the manual version starts to hurt
Running this by hand works, and plenty of shops do it forever with a spreadsheet and a kitchen scale. The friction shows up in two places. First, topping-waste and melt counts depend on staff logging things consistently — and consistency erodes the moment a Saturday gets slammed. Second, the reconciliation math is tedious enough that people start skipping it, which is exactly when shrink creeps back.
Operational software that pulls your POS sales, ties them to portion costs, and flags a KPI the moment it crosses into red genuinely saves the drill from quietly dying. Not because it's clever, but because it removes the two steps people abandon first. When the system handles the reconciliation and surfaces "shrink is at 3.4%, worst on evening shifts" without you doing the math, the drill survives a busy week. The goal isn't automation for its own sake — it's making sure the fifteen-minute habit actually happens every week, not just the weeks you feel like it.
The takeaway
Four numbers. Clear thresholds. One experiment at a time, run inside a one-week window so the fix lands while the problem is still fresh. The shops that stay profitable aren't the ones with the fanciest reports — they're the ones who catch the over-scooping closer or the two-degree-warm case in week one instead of week five. Run it this Sunday, pick your worst number, and design one cheap experiment. Then check next week whether it worked. That loop, repeated, is most of what separates a shop that guesses from a shop that knows.
Ready to scoop up efficiency and grow your shop?
Join hundreds of ice cream shops using Cremyly to boost productivity, reduce waste, and delight customers with faster service.