

Most floor experiments in a scoop shop die for a boring reason: nobody can see them. You decide on Monday to test a faster upsell line or a new sample-to-sale script, tell your two openers, and by Thursday nobody remembers the plan because it lived in a group chat buried under schedule swaps and a "who has the keys" argument.
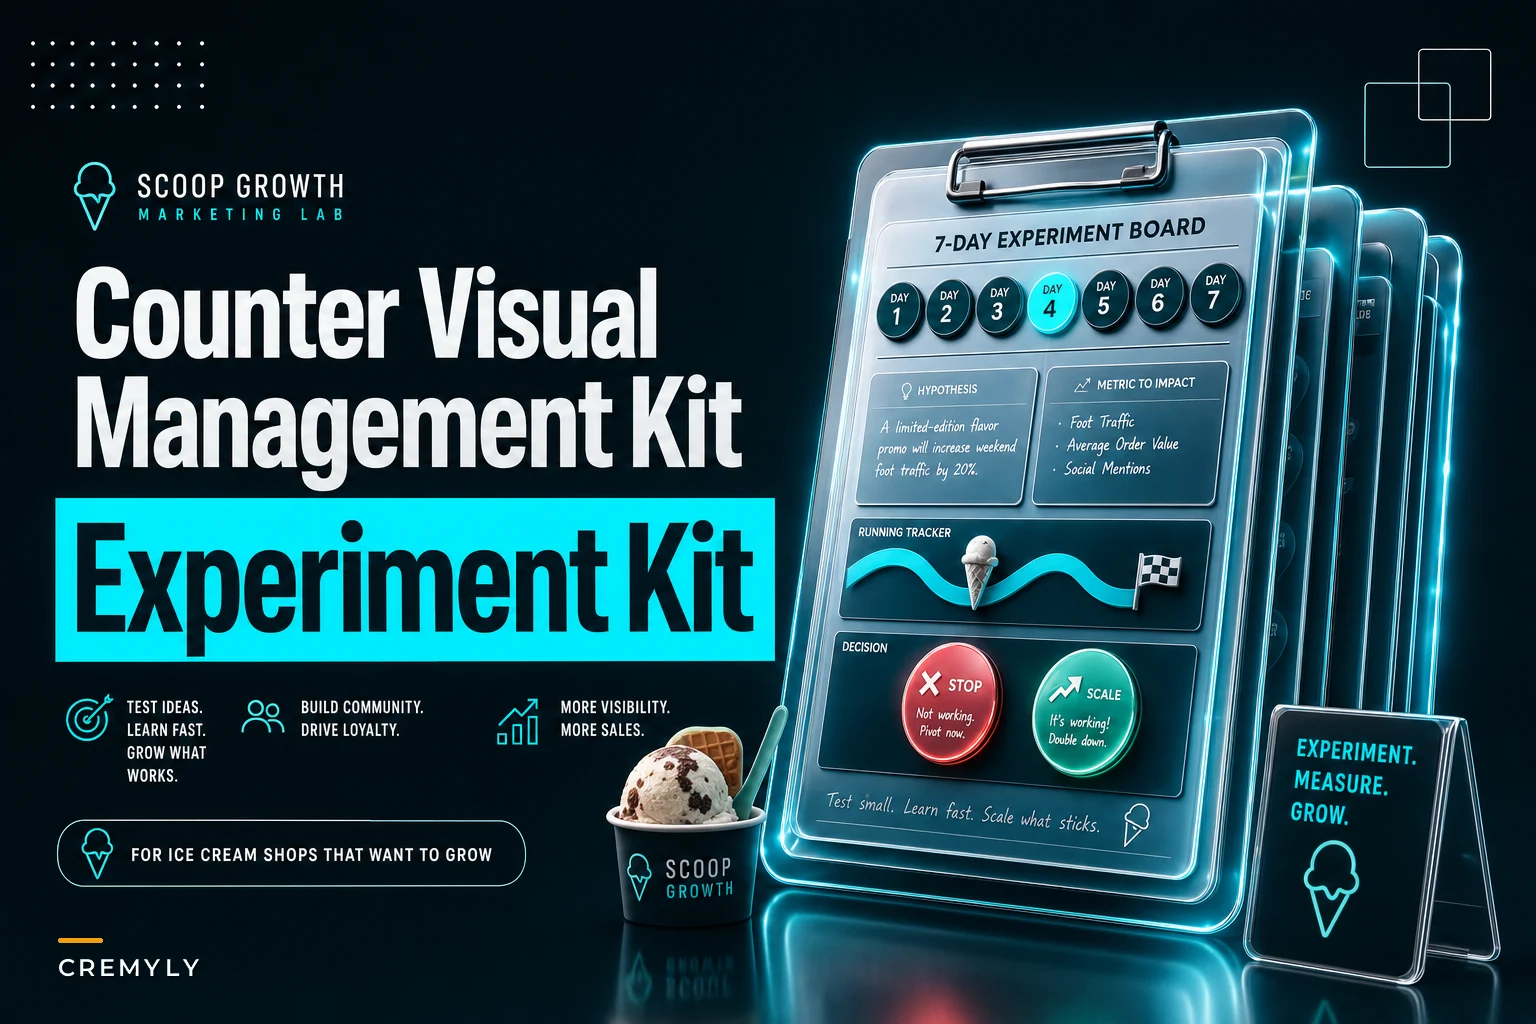
A visual management board fixes this — not because it's fancy, but because it sits at eye level where the work actually happens. The whole point of a visual management board for retail counters is that a 17-year-old scooper on their third shift can glance at it between customers and know exactly what's being tested, what number they're supposed to move, and whether it's working.
This is a kit, not a philosophy. You'll get printable board layouts you can run off at any print shop, three signals short enough to track by hand during a rush, and a 7-day protocol with explicit rules for when to kill the test or roll it out.
Why counter experiments usually fall apart
The failure pattern is almost always the same. Owners treat the experiment like a decision ("we're doing upsells now") instead of a measured test with a clear end date. No baseline, no visible target, no agreement on what "it worked" actually means. So three weeks later you're in a debate: "I feel like the waffle cone push is working" vs "honestly it just slows the line down." Neither side has numbers. The loudest opinion wins.
The second failure is complexity. People try to track eight metrics, build a spreadsheet, and ask staff to log things on their phones. During an August Saturday with a line out the door, that logging doesn't happen. The data you get back is garbage — and worse, the staff quietly resent the whole thing.
A good counter board solves both problems: it forces one clear question, caps you at a small number of signals, and lives physically in the workspace so tracking is a tally mark, not a data-entry chore.
The three signals (and why only three)
You get three. Not because three is magic, but because anything a busy scooper has to remember during service needs to fit in working memory alongside flavors, allergens, and the register. Past three, compliance collapses.
Keep your ice cream shop running smoothly.
Cremyly helps you manage every order, stock level, and staff shift with precision and ease.
- Real-time inventory tracking
- Order management dashboard
- Staff scheduling & shift coordination
No credit card required
Each signal should be one of these types:
| Signal type | What it measures | How staff capture it | Good for testing |
|---|---|---|---|
| Count signal | How often something happened | Tally marks on the board | Upsells, sample conversions, add-ons |
| Rate signal | Speed or throughput | Timer + a few spot checks per shift | Line speed, prep handoffs |
| Quality signal | Defects or rejects | Tally of misses only | Overfilled scoops, melt, remakes |
The trick is picking signals that are countable without stopping work. "Average customer satisfaction" is not countable mid-shift. "Did we offer the topping upsell: yes/no tally" is. If a signal requires judgment or a conversation to record, it won't survive a real rush.
One pattern worth naming: the strongest experiments pair one count signal with one quality signal. You push a behavior (count) while watching for the side effect it might cause (quality). Push cone upgrades, track remakes from rushed scooping. This catches the classic trap where a test "works" on revenue but quietly wrecks something else.
Pair a simple count with a narrow quality tally so you can spot trade-offs—revenue vs. remakes—at a glance.
The strongest experiments pair one count signal with one quality signal. You push a behavior while watching for the side effect it might cause.
The printable board layouts
Keep boards on a clipboard or laminated sheet right at the register or on the back of the sneeze guard where only staff see it. Clipboard-ready means standard letter size, big tally zones, no tiny fonts.
Layout A — Single Count Test (simplest)
``
EXPERIMENT: Offer brownie add-on to every kids' cup
TARGET: Offer on 80% of kids' cups  |  Convert 1 in 4

Day:    Opener initials:

OFFERS MADE:   |||| |||| |||| ||
CONVERSIONS:   |||| ||
MELT/REMAKES:  |

Notes: __
``
Layout B — Speed Test
``
EXPERIMENT: New pre-scoop prep for top 3 flavors
TARGET: Order-to-handoff under 90 sec

Spot checks (pick 5 random orders this shift):
1:  sec   2:  sec   3: __ sec
4:  sec   5:  sec

Longest observed: _ sec
Anything that broke the flow: ___
``
Layout C — Count + Quality Paired
``
EXPERIMENT: __
QUESTION WE'RE ANSWERING:

Primary count:   |||| |||| ||||
Did-not-happen:  |||
Quality misses:  ||

Shift verdict (circle):  BETTER  SAME  WORSE
``
Print a week's worth. Date each sheet. At close, the signals get transferred to one running tracker — a single page or a shared sheet — so you can see the trend across all seven days instead of judging by the last shift you personally worked.
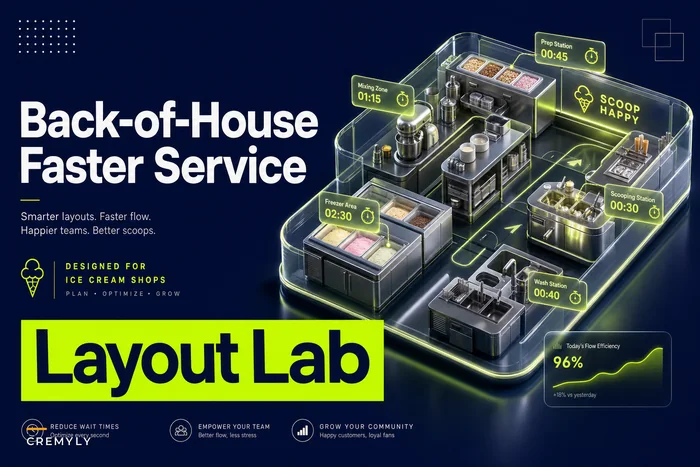
If your board changes are tied to how the counter and back line physically flow, it's worth reading our breakdown of back-of-house layouts that cut handoffs and service time before you test any speed signal. A prep bottleneck will wreck your timing data and you'll end up blaming the wrong thing.
The 7-day protocol
Seven days because it covers a full weekly cycle: your dead Tuesday, your busy Saturday, the weird Sunday rush, everything. Testing for three days and declaring victory is how you roll out a change that only worked because it rained and the shop was quiet.
-
Day 0 (the day before) Set the baseline. Pull last week's numbers for whatever you're testing, or run one normal day and record it on the board without changing anything. You can't judge an experiment with no "before."
-
Day 1–2 Launch. Expect the signals to look rough. New behavior is clumsy. Do not touch anything yet — resist the urge to "fix" the test on day one.
-
Day 3 First check-in. Look only at compliance (did staff actually do the thing?), not results. If the behavior isn't happening, the problem is the instruction, not the idea.
-
Day 4–6 Hold steady. This is where real signal emerges, once the newness wears off.
-
Day 7 Decide. Apply the stop/scale rules below.
Keep one owner or lead accountable for moving the daily tallies to the running tracker. The single biggest cause of a wasted experiment week is nobody consolidating the numbers, so on Day 7 you're staring at seven loose clipboards and guessing.
Stop/scale rules (decide in advance, not in the moment)
-
SCALE IT if the primary signal beats baseline by a meaningful margin (set your own — conversions up a quarter or more, for example) and the quality signal didn't get worse.
-
EXTEND ONE WEEK if the trend is positive but compliance was under roughly 70% — you tested a half-run version, so run it again done right.
-
KILL IT if the primary signal is flat or down after full compliance, or if the quality signal got worse enough to cause remakes, waste, or a slower line.
-
KILL IT IMMEDIATELY (mid-week) if a quality miss hits a safety or allergen issue. Those aren't experiments you tune — those stop now.
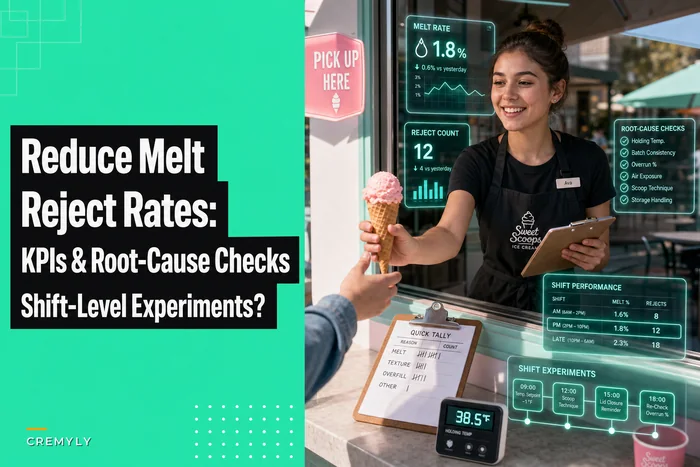
The paired quality signal matters most here. A classic example: an upsell test boosts add-on revenue but the remake rate climbs because scoopers are rushing. On revenue alone you'd scale it. With the paired signal, you see you're trading margin for waste. If melt and remakes are your quality signal, our notes on reducing melt-and-reject rates will help you figure out whether the rise is the experiment's fault or just a hot week.
Here's a quick visual of the 7-day experiment workflow.
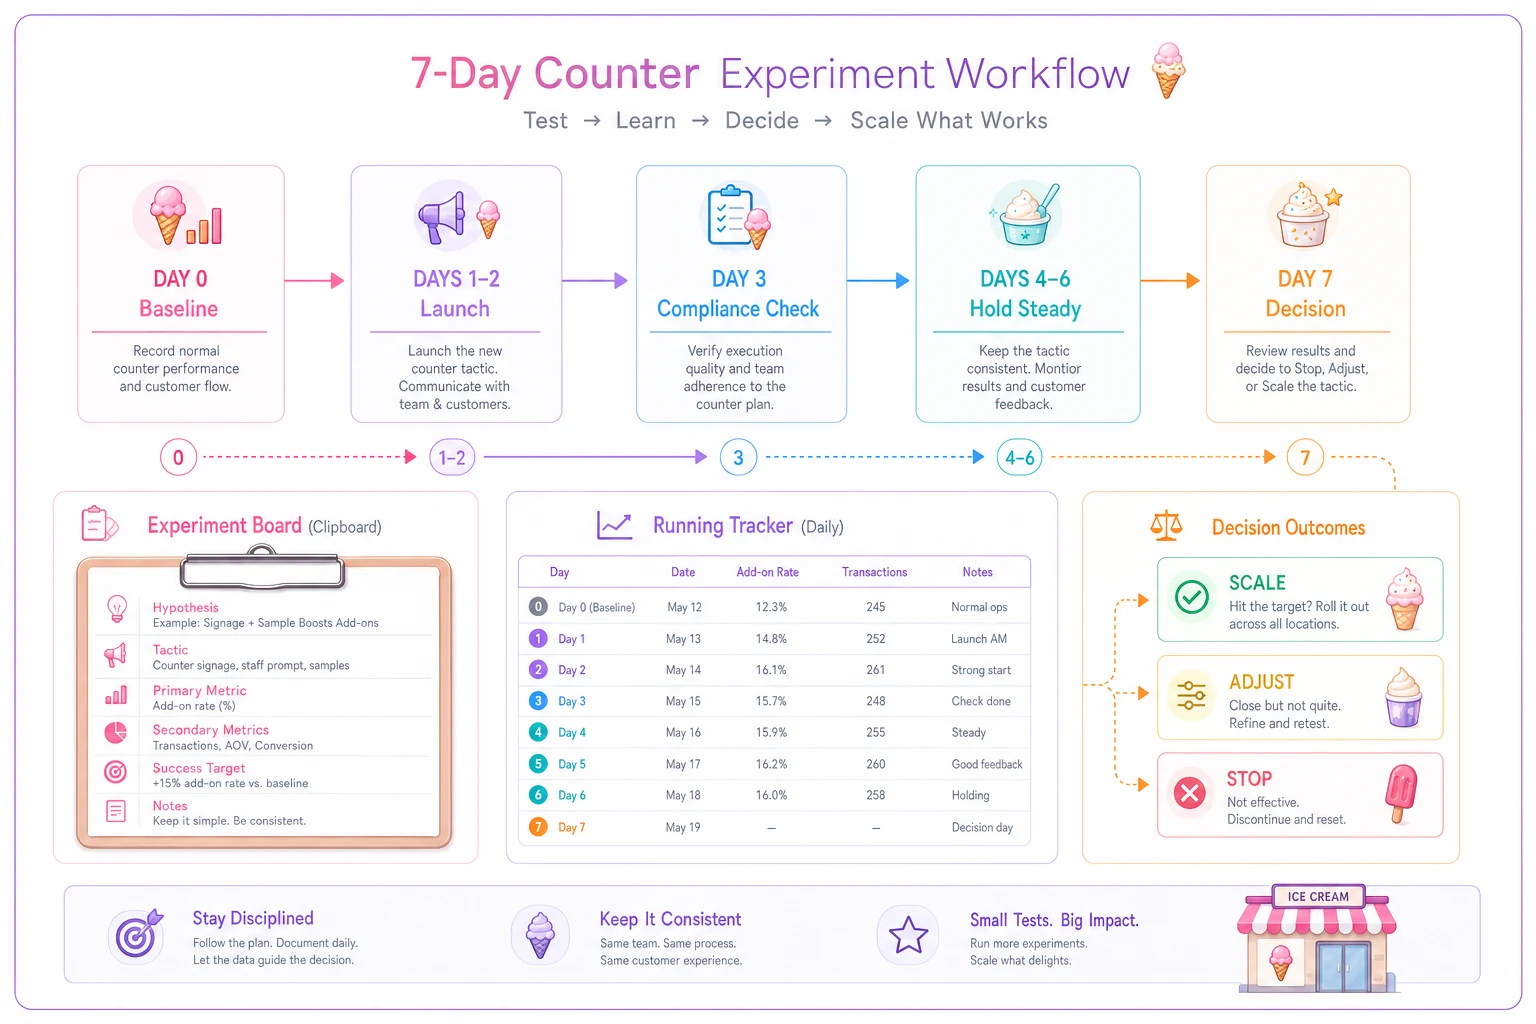
The paired quality signal matters most here. A classic example: an upsell test boosts add-on revenue but the remake rate climbs because scoopers are rushing. On revenue alone you'd scale it. With the paired signal, you see you're trading margin for waste.
A real scenario
A single-location shop doing roughly $14k–$17k in a good summer week wanted to push a $1.50 house-made sauce add-on. Previous attempts had "failed" — but there'd never been a real test, just a vague push that fizzled.
They ran Layout C for seven days. Primary count: sauce offered per sundae or cup order. Quality signal: remakes and visible overflow messes from the extra handling.
Baseline day showed sauce was offered on maybe 2 out of 10 eligible orders, mostly by one enthusiastic opener. By Day 4, with the board sitting right at the register as a reminder, offers were happening on close to 7 out of 10. Conversion landed around 1 in 3. The quality signal stayed basically flat — a couple of extra wipe-downs, nothing structural.
The math wasn't dramatic but it was real: roughly 30–40 extra sauce add-ons across the week at $1.50, on near-pure margin since the sauce was already being made. Somewhere around $180–$220 that week, mostly profit, no new labor. More importantly, they knew it worked and why, so rolling it out permanently wasn't a debate. They printed a permanent reminder card and retired the experiment board.
The part they almost got wrong: on Day 2 the opener who hated upselling pushed to kill it. If they'd decided on emotion mid-week, it dies. The protocol held them to Day 7, and what looked like a slow start turned out to be the learning curve, not a signal the idea was bad.
When this makes sense
You keep having "I feel like X works" arguments with no data behind them.
-
You keep having "I feel like X works" arguments with no data behind them.
-
You've got a specific, countable behavior you want to test — not a vague vibe.
-
Your staff are on the floor and can't realistically log into anything mid-rush.
-
You want a repeatable way to try small changes without betting the whole operation.
This kit earns its keep when you have multiple staff across multiple shifts and need a shared, visible source of truth that survives handoffs.
When this is a bad idea
You're testing something that can't be counted at the counter. Brand perception, "do customers like the new look" — a tally board won't help you there.
-
You're testing something that can't be counted at the counter. Brand perception, "do customers like the new look" — a tally board won't help you there.
-
Your baseline is a mess. If your POS tagging is inconsistent and you don't know your normal numbers, fix measurement first. A clean experiment on a dirty baseline tells you nothing.
-
You're in a crisis week. Freezer trouble, a staffing hole, a heat wave — don't layer an experiment on top of a shift that's already fighting fires. The data will be noise.
-
You can't resist tweaking mid-test. If you'll change the rules on Day 2 every time, the protocol can't protect you from yourself. Either commit to seven days or don't start.
You can't resist tweaking mid-test. If you'll change the rules on Day 2 every time, the protocol can't protect you from yourself. Either commit to seven days or don't start.
Who should not run this
If you're a single operator working every shift alone, the board is lower value — you already see everything and can test and adjust in your head.
This kit earns its keep when you have multiple staff across multiple shifts and need a shared, visible source of truth that survives handoffs. The whole benefit is that whoever closes Thursday knows exactly what the opener on Monday was testing, without anyone having to call a meeting.
Keeping the running tracker simple
The one piece that lives off the counter is your week-long tracker — the sheet where each shift's tallies get consolidated so you can see the trend. Single printed grid, whiteboard in the back, basic shared spreadsheet. The format matters less than actually filling it in daily.
If you're already running a floor board or a daily operations dashboard, the experiment tracker just becomes another row that shows up for seven days and disappears. Shops using operational software with a shared log tend to have an easier time here — daily numbers get consolidated automatically instead of depending on someone remembering to type up seven clipboards on Day 7, which is realistically the step that gets skipped.
That said, a laminated sheet and a marker works fine if that's what your team will actually use. The tool is whatever survives a Saturday rush.
The honest takeaway
Most floor experiments fail not because the idea was wrong, but because it never became visible, measurable, or time-boxed. A clipboard board forces the question into the open. Three signals keep it trackable during real service. The 7-day window with pre-written stop/scale rules keeps your own biases from hijacking the result.
Run one experiment at a time. Print the board. Set the stop/scale numbers before you start. Decide on Day 7, not the day your least enthusiastic staffer complains. That's the whole discipline — and it's the difference between "I think that worked" and actually knowing it did.
Run one experiment at a time. Print the board. Set the stop/scale numbers before you start. Decide on Day 7, not the day your least enthusiastic staffer complains. That's the whole discipline — and it's the difference between "I think that worked" and actually knowing it did.
Ready to scoop up efficiency and grow your shop?
Join hundreds of ice cream shops using Cremyly to boost productivity, reduce waste, and delight customers with faster service.