
Your POS system probably has 200+ transaction records from yesterday. Maybe 47 of them were strawberry scoops, 23 were waffle cones, and somewhere in there you ran that Tuesday afternoon BOGO deal that pulled in the after-school crowd. But what kills me is that most shop owners can tell you exactly how many gallons of vanilla they went through last week and have no idea which promotions actually drove profit versus just moved inventory.
The problem isn't tracking sales. Every modern POS does that. The problem is that without proper tag taxonomy, you're looking at raw transaction noise instead of anything useful. You know you sold 14 mint chocolate chip cones yesterday, but you don't know if those were part of your "Summer Mint Madness" promo, regular menu sales, or that birthday party that ordered 8 of them at once.
I've watched shops run the same promotions month after month because "they seem popular" while their actual margin data shows those promos are barely breaking even after factoring in extra labor during rush periods. Meanwhile, some random flavor pairing they tried once and never tracked properly could've been their highest-margin seller if they'd tagged it right.
The real cost of bad tagging
Most shops start with whatever default categories their POS offers. Usually something like "Ice Cream," "Toppings," "Beverages." Then tags get added randomly as situations come up. "Birthday Party." "Catering." "Happy Hour." After six months you've got 80+ tags that overlap, contradict, and tell you nothing useful about operations.
A shop showed me their tag list last month. They had "Summer Special," "Summer Promo," "Seasonal - Summer," and "June Special" all running at the same time. When we mapped their transactions, roughly 40% of summer promotional sales weren't tagged at all because staff didn't know which tag to use. Another 30% were double-tagged, making their reports basically useless. They thought their summer push increased sales by 15%. After cleaning up the taxonomy and rerunning the numbers, the actual increase was closer to 4%, and most of that came from three specific afternoon timeslots when they had extra staff scheduled anyway.
The taxonomy problem compounds when you try connecting sales data to inventory and labor. That "Sundae Sunday" promotion might show strong sales numbers, but if you can't track which sundae types sold, you can't adjust your prep schedule Monday morning. Your team ends up prepping based on gut feel—usually over-prepping popular flavors and under-prepping everything else.
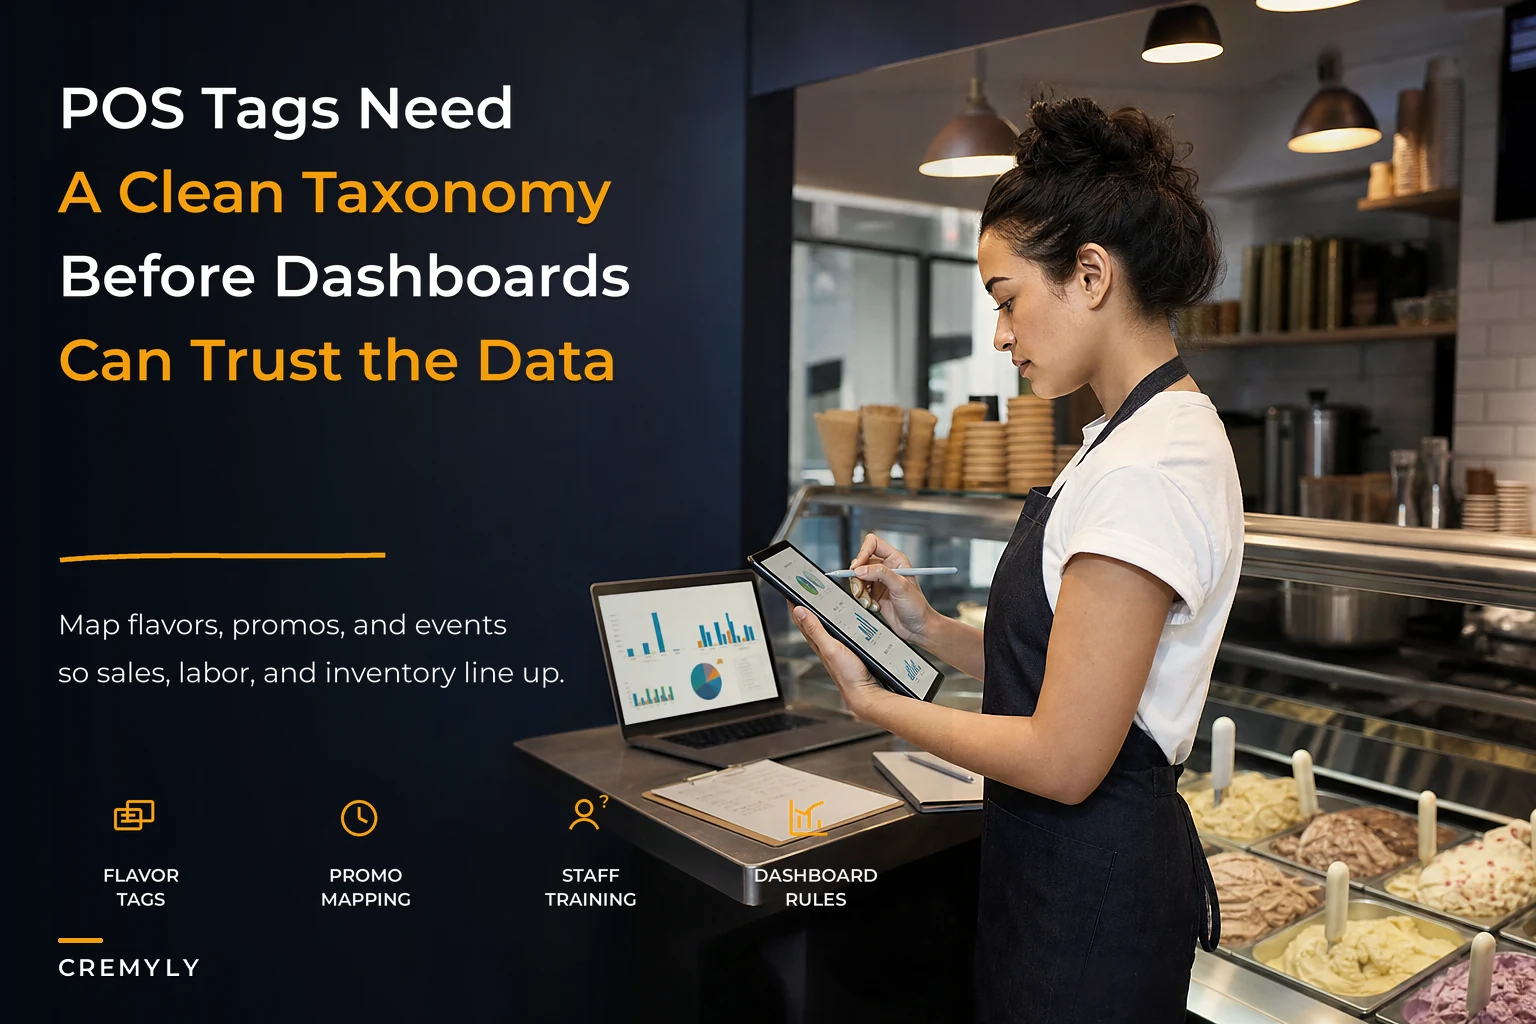
Building tag architecture that actually maps to operations
Here's how tag taxonomy should work in a scoop shop, broken into three layers:
Keep your ice cream shop running smoothly.
Cremyly helps you manage every order, stock level, and staff shift with precision and ease.
- Real-time inventory tracking
- Order management dashboard
- Staff scheduling & shift coordination
No credit card required
Product taxonomy captures what sold and how it was configured. Not just "ice cream" but the full context:
-
Base
flavor category (classic, premium, seasonal, limited)
-
Format
cone, cup, pint, quart, cake, sundae
-
Customization
single, double, triple, mixed flavors
-
Temperature state
standard, soft-serve, milkshake base
Promotion taxonomy tracks why it sold at that price point:
-
Promotion type
percentage off, BOGO, bundle, loyalty reward
-
Trigger
time-based, weather-based, inventory-clearing, event-driven
-
Customer segment
kids, students, seniors, members
-
Margin impact
full-price, discounted, loss-leader, upsell
Context taxonomy captures the operational conditions:
-
Service type
counter, pre-order, catering, delivery
-
Peak classification
rush, standard, slow
-
Weather condition
hot (85+), warm (70-84), mild (60-69), cold (<60)
-
Event proximity
game day, school event, holiday, festival
The magic happens when these layers connect. A transaction tagged as "Premium flavor + Double scoop + Waffle cone + Student discount + Rush period + Hot weather" tells you infinitely more than "Ice cream sale $7.50."
Mapping tags to actual business decisions
A properly tagged transaction should answer three operational questions:
-
What inventory did this deplete and what needs prepping?
-
What labor did this require and when?
-
What margin did this actually generate?
Take a "Friday Night Lights" promotion—free topping with any double scoop during high school games. Without proper tagging, it looks like a popular promo. With the right taxonomy, you might discover:
-
70% of orders choose hot fudge (highest cost topping)
-
Orders cluster in 20-minute waves during game breaks
-
The promo converts single-scoop regulars to doubles (good) but also converts full-price double buyers to discounted doubles (bad)
This connects directly to margin tracking systems where every promotional decision needs operational cost mapping.
Creating your starter taxonomy (the 30-60-90 approach)
First 30 tags (Core Operations)
Start with the basics that directly impact inventory and labor:
| Category | Tags | Maps to |
|---|---|---|
| Flavors | Vanilla-base, Chocolate-base, Fruit-base, Nut-base, Specialty | Inventory groups, allergen tracking |
| Formats | Scoop-cup, Scoop-cone, Pint, Quart, Cake, Sundae | Prep requirements, packaging needs |
| Size | Kids, Single, Double, Triple, Share-size | Portion control, pricing tiers |
| Time | Morning, Lunch, Afternoon, Evening, Late-night | Labor scheduling, prep timing |
| Service | Counter, Pre-order, Catering, Delivery | Workflow routing, capacity planning |
Next 30 tags (Promotional Intelligence)
Add tags that explain pricing and customer behavior:
| Category | Tags | Maps to |
|---|---|---|
| Discounts | Student, Senior, Member, Employee, Birthday | Customer segments, frequency patterns |
| Promos | BOGO, Happy-hour, Weekend-special, Flash-sale | Margin impact, rush management |
| Events | Game-day, Festival, Holiday, School-event | Demand spikes, special prep |
| Weather | Heat-wave, Perfect-day, Rainy, Cold-snap | Sales correlation, waste prediction |
| Payment | Cash, Card, App, Gift-card, Loyalty-points | Transaction cost, customer value |
Final 30 tags (Optimization Signals)
These help surface hidden patterns:
| Category | Tags | Maps to |
|---|---|---|
| Quality | Fresh-batch, Day-old, Last-scoop, Perfect-temp | Product rotation, waste tracking |
| Customer | Regular, First-timer, Tour-group, Party-host | Lifetime value, service needs |
| Issues | Remake, Complaint, Comp, Spill | Quality control, training needs |
| Tests | New-flavor, Price-test, Portion-test, Recipe-variant | Innovation tracking, menu development |
| Special | Custom-order, Allergen-free, Diet-restricted, Special-request | Complexity cost, prep requirements |
These help surface hidden patterns:
The 30-day retro-tag cleanup process
Most shops have six months of messy data before they realize they need proper taxonomy. Here's how to clean it up without losing your mind:
Week 1: Transaction sampling and pattern identification
Pull 100 random transactions from your busiest day last month. For each one, try to answer:
-
What exactly was sold?
-
Why was it priced that way?
-
What operational resources did it consume?
You'll quickly see where your current tags fail. Maybe every birthday party order just shows as "multiple ice creams" with no flavor detail. Or your BOGO sales don't indicate which items were free versus paid.
Week 2: Historical reconstruction
Focus on your top 20% of transactions by value. These usually represent:
-
Large orders (parties, catering)
-
Premium products (cakes, specialty sundaes)
-
Repeat customers (daily regulars, weekly families)
Create retroactive tags for these based on any notes, special instructions, or patterns you can identify. A $47 order every Sunday at 2 PM is probably the Thompson family's weekly tradition—tag it as such.
Week 3: Staff training and tag standardization
Your team needs to understand why accurate tagging matters. Show them how a properly tagged "Rush hour + Hot weather + Double scoop" transaction justifies keeping two people on register during summer afternoons. Or how tracking "Pre-order + Birthday cake + Chocolate base" helps predict weekend prep needs.
Create a simple decision tree:
-
What did they buy? (product tag)
-
Did they get a special price? (promotion tag)
-
Anything unusual about this sale? (context tag)
Week 4: Testing and adjustment
Run reports on your newly tagged data. Look for:
-
Tags that never get used (too specific)
-
Tags that get overused (too broad)
-
Missing connections (sales that should correlate but don't)
One shop found their "afternoon special" tag was being applied to any sale between noon and 6 PM, which made it worthless. They split it into "lunch-rush," "after-school," and "pre-dinner" and suddenly could see that after-school sales had roughly 3x the profit margin of lunch-rush.
Quick visual to follow the 30-day cleanup steps:
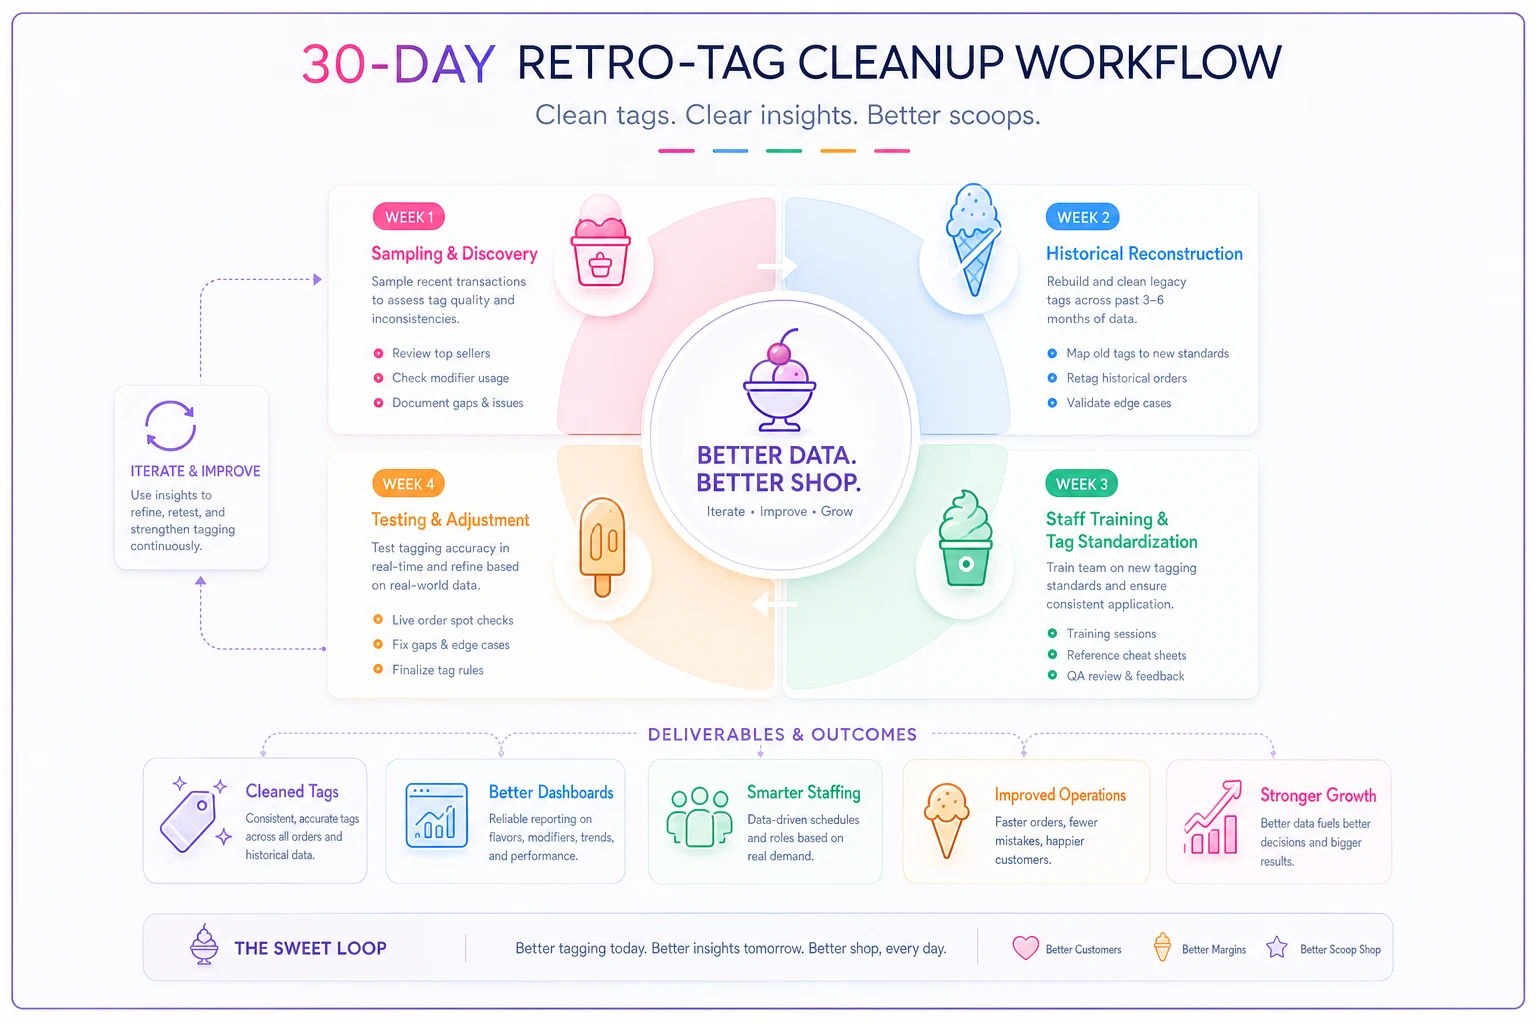
This process turns messy historical data into actionable tags and feeds into dashboards and staffing changes.
How clean taxonomy drives better decisions
With proper tagging, patterns start emerging that actually change how you operate:
Inventory connections: That "Tropical Tuesday" promotion doesn't just sell mango and coconut. It also drives 40% more waffle cone sales and depletes pineapple topping twice as fast. Now you know to prep extra cones Monday night and order more pineapple for Monday delivery.
Labor optimization: "Student discount" tags show 80% of student traffic hits between 3:15–4:30 PM on weekdays. Instead of keeping full staff until 5 PM, you scale down at 4:30 and save several labor hours per week without hurting service.
Margin reality: Your "Family Four-Pack" (4 singles for $12) looks profitable until tags reveal 60% of buyers would've purchased doubles at full price. The promo is actually costing you margin on transactions you would've gotten anyway. This is where portion-based pricing models become critical for understanding true promotion cost.
Building dashboards that actually guide operations
Once your taxonomy is clean, you need dashboards that turn data into decisions. Skip the vanity metrics and focus on operational triggers:
Daily operational dashboard:
-
Current shift
sales by tag, active promos, labor efficiency
-
Next shift
predicted demand, prep requirements, staffing needs
-
Issues
remakes, complaints, inventory warnings
Weekly planning dashboard:
-
Tag performance
which drove sales, which hurt margins
-
Inventory correlation
tag-to-usage mapping, waste by category
-
Labor alignment
tags per labor hour, rush coverage gaps
Monthly strategy dashboard:
-
Promotion ROI
true margin after operational costs
-
Customer patterns
tag combinations by segment
-
Optimization opportunities
underused inventory, overstaffed periods
Make sure every dashboard metric includes a one-line action so the team knows the next step.
The key is making sure each dashboard element has a clear action attached. "Student sales up 15%" is useless. "Student sales up 15%, concentrated 3–4 PM, 85% choosing fruit flavors" tells you to prep more fruit bases before 3 PM on school days.
Common taxonomy mistakes that kill profitable patterns
Over-tagging syndrome: Some shops create tags for everything. "Tuesday-afternoon-regular-Bob" might seem clever, but it creates noise. Stick to tags that affect operations, inventory, or margins.
Promotion overlap chaos: Running multiple promotions without exclusive tags makes analysis impossible. If someone can use both "Summer Special" and "Student Discount," you need tags for "Summer-only," "Student-only," and "Summer+Student" to track real impact.
Time granularity problems: "Morning" versus tracking every hour. Most shops need 5–6 time blocks max: pre-open, morning, lunch, afternoon, evening, late night. More granular and staff won't tag consistently. Less granular and you miss patterns.
Flavor abstraction failures: Tagging "chocolate" when you carry milk chocolate, dark chocolate, and chocolate fudge. Each has different costs, popularity, and inventory needs. Your taxonomy should match your operational reality.
When automated tagging makes sense (and when it doesn't)
The dream is everything auto-tagging based on rules. Some of this actually works:
-
Time-based tags (rush periods, day parts)
-
Weather-based tags (pulling from local data)
-
Promotion tags (based on discount codes)
-
Payment method tags
But plenty still requires human input:
-
Customer type (regular versus tourist)
-
Special requests
-
Quality issues
-
Event context
The shops that nail this use AI-powered operational platforms to handle the automatic stuff while building simple workflows for staff to add context. When someone orders a birthday cake, the system auto-tags the base characteristics while prompting staff to add celebration type and party size.
This hybrid approach means you capture the operational data that matters without turning every transaction into a data entry marathon. Your POS handles the what, automated rules handle the when, and staff add the why when it matters.
The path forward: from random tags to operational intelligence
Start simple. Pick 10 tags that would immediately impact tomorrow's operations if you had clean data on them. Maybe:
-
Your top 5 flavors by base type
-
Rush versus standard periods
-
Full-price versus discounted sales
-
Counter versus pre-order
-
Standard versus custom requests
Track these exclusively for one week. No other tags. See what patterns emerge. Then add 5 more tags the next week. Build your taxonomy based on actual operational needs, not theoretical categorization.
The shops that get this right stop thinking about tags as data fields and start treating them as operational sensors. Each tag answers a specific question that drives a specific decision. When every transaction tells you not just what sold but what it means for inventory, labor, and margins, you stop running on instinct and start operating on something more solid.
The difference between a shop that survives and one that scales isn't the quality of ice cream or the location or even the marketing. It's the ability to see patterns in your operations and adjust before problems get expensive. That starts with knowing what to track, how to track it, and what to actually do with what you learn.
Your POS is recording everything anyway. The question is whether you're going to organize that data in a way that helps you make better decisions, or let it pile up as digital noise while you run on gut feel and hope for the best.
Ready to scoop up efficiency and grow your shop?
Join hundreds of ice cream shops using Cremyly to boost productivity, reduce waste, and delight customers with faster service.