


The first store you run on instinct. You know the Saturday rush, you know which freezer hums wrong, you know when the milk guy is late.
The second store breaks that instinct — because now you're reading two sets of numbers that don't line up, and you can't be standing behind both counters at once.
By the third store, most owners are flying blind in a very specific way: they feel busy, they feel like money is moving, but they genuinely cannot tell you which location is carrying the chain and which one is quietly bleeding. That's the real problem multilocation financial consolidation small retail is supposed to solve — not fancy accounting, just a clean way to see the whole business and each piece of it at the same time.
This is the practical version. Inter-site transfer rules, how to handle shared-service costs that get messy fast, unit-economics for comparing stores fairly, and a copy-paste 13-week consolidated forecast you can actually build this weekend. There are worked journal entries and remediation rules too, because transfers between your own stores are where most small chains lose the plot.
The thing that actually breaks when you add stores
It's not sales. Sales usually grow fine. What breaks is attribution — knowing which dollar belongs to which store.
Here's the pattern. Store A has the big walk-in freezer and extra batch capacity, so it starts making mix or holding backup tubs for Stores B and C. Nobody prices those transfers. Store A's food cost looks terrible because it's absorbing production for the whole chain. Store B looks like a genius because it's getting product basically for free. The owner stares at the P&Ls and concludes Store A has a cost problem and Store B is the model to copy. Both conclusions are wrong.
Then there's the shared stuff. One bookkeeper, one marketing spend, one commissary lease, one software bill. Early on you just pay these out of whichever account has cash. Six months later you have no idea what any single store actually earns, because a third of its real cost is sitting in a pile labeled "overhead" that never got pushed down to anyone.
A clean consolidation model fixes three separate questions that owners tend to mash into one:
-
How's the whole business doing? (consolidated P&L and cash)
-
How's each store doing on its own? (unit economics, fairly loaded)
-
Are the stores settling with each other correctly? (inter-site transfers)
Keep those three straight and almost everything else gets easier. If you're earlier in this journey, the structural side of going multi-site is worth reading alongside this — the four-layer replication map and 90-day new-site checklist covers the operational scaffolding this financial model sits on top of.
Inter-site transfers: the quiet margin scrambler
When you own all the stores, it feels a little silly to "charge" one location for product another location made. But if you don't, your numbers lie to you. The fix isn't complicated, it just has to be consistent.
Keep your ice cream shop running smoothly.
Cremyly helps you manage every order, stock level, and staff shift with precision and ease.
- Real-time inventory tracking
- Order management dashboard
- Staff scheduling & shift coordination
No credit card required
Pick one transfer-pricing rule and never mix them mid-year
| Transfer method | How it works | Best for | Watch out for |
|---|---|---|---|
| At cost | Store A charges Store B exactly what the goods cost to make/buy | Most small chains | Producing store shows no benefit, can hide its own inefficiency |
| Cost-plus | Cost plus a small markup (say 8–12%) | When one site is basically a commissary | Markup inflates receiving store's COGS; needs clear logic |
| Market/retail-equivalent | Priced as if bought from a supplier | Franchise-style or when you want true standalone P&Ls | More admin, can feel punitive internally |
For a 3-to-6 store chain with one production-heavy location, cost-plus at a modest markup is usually the sweet spot. It lets the producing store recover a little of its labor and freezer burden, and it keeps the receiving store honest about what product actually costs. The markup doesn't have to be "profit" — think of it as covering the real overhead of being the hub.
A worked transfer, start to finish
Say your commissary store (Store A) batches 40 tubs of vanilla base and ships 15 of them to Store C. Your fully-loaded cost per tub is about $11.20 (ingredients, mix labor, a slice of freezer energy). You run cost-plus at 10%. Transfer price per tub = $11.20 × 1.10 = $12.32 Total transfer = 15 × $12.32 = $184.80
Journal on the consolidated books (intercompany):
Store A (producing site): Dr Intercompany Receivable – Store C $184.80 Cr Inter-site Transfer Revenue $184.80 Dr COGS – Transferred Out $168.00 (15 × $11.20) Cr Inventory – Finished Base $168.00 Store C (receiving site): Dr Inventory – Finished Base $184.80 Cr Intercompany Payable – Store A $184.80
At the consolidated level, when you roll everything up, that transfer revenue and the matching COGS/payable eliminate against each other — the chain didn't sell anything to the outside world, it just moved a tub across town. The $16.80 of markup ($184.80 − $168.00) washes out in consolidation. But on each store's standalone P&L, the numbers now tell the truth: Store A gets credited for the work, Store C carries a realistic product cost.
Remediation rules for when transfers go wrong
-
No transfer without a logged slip. Date, from-store, to-store, item, quantity, agreed price. If it's not logged, it didn't happen — and the receiving store eats the cost until it's reconciled.
-
Weekly intercompany reconciliation. Store A's receivable from Store C must equal Store C's payable to Store A. If they don't match, you have a missing or duplicate slip. Find it that week, not at year-end.
-
Variance threshold. Any transfer where the logged cost and physical count differ by more than roughly 5% gets flagged and investigated, not just adjusted away.
-
One person owns the sign-off. Usually the bookkeeper or ops lead. Transfers are the easiest place for shrink to hide because it looks like internal movement, not loss.
-
Monthly truing. Reset any accumulated small discrepancies, document the adjustment, note the cause. Patterns in those causes show you where your process leaks.
The remediation discipline matters more than the pricing method. A chain running "at cost" with tight logging beats a chain running perfect cost-plus with sloppy slips every time.
Shared-service governance: stop burying store costs in "overhead"
Every multi-store owner builds a shared-services layer whether they plan to or not. Bookkeeping, marketing, a regional manager's salary, insurance, the software stack, maybe a central commissary lease. The question is whether those costs get allocated down to stores or just float in a corporate bucket where they quietly distort everything.
The allocation problem in plain terms
If you spend around $4,000 a month on shared services and don't push it to the stores, each store's P&L looks rosier than reality. The chain might be profitable while two individual stores lose money once properly loaded — and you'd never know, so you'd never fix it.
| Shared cost | Fair allocation driver | Why |
|---|---|---|
| Bookkeeping / admin | Number of transactions or flat per-store | Work scales with activity, not revenue |
| Marketing (brand) | Revenue share | Bigger stores benefit more from brand spend |
| Regional manager | Hours spent per store, or headcount | Follows where the labor supervision goes |
| Insurance | Store count or square footage | Risk tracks physical footprint |
| Software / POS | Per-store flat fee | Each store is one node |
| Commissary lease | Volume of product pulled per store | Usage-based is fairest |
The mistake almost everyone makes: allocating everything by revenue because it's the easiest number to grab. Revenue-based allocation punishes your high-volume stores and lets low-volume stores hide. A busy store doesn't use ten times the bookkeeping just because it sells ten times the ice cream.
Keep it simple, keep it documented
You don't need a cost-accounting degree. Pick a driver per cost category, write it down, and apply it the same way every month. The documentation is what protects you — when a store manager argues their numbers look bad because of "corporate costs," you can show exactly what was allocated and why. Governance is really just: we agreed on the rules in advance and we're not changing them to win an argument.
Document your chosen allocation drivers and keep the allocation rules in the same shared file so managers can reference them.
The documentation is what protects you — when a store manager argues their numbers look bad because of "corporate costs," you can show exactly what was allocated and why. Governance is really just: we agreed on the rules in advance and we're not changing them to win an argument.
Unit-economic reporting: compare stores fairly or don't compare them at all
Consolidated numbers tell you if the business is alive. Unit economics tell you which store to copy and which to fix. But comparisons only work if you're comparing fairly loaded, standalone store P&Ls — transfers priced, shared services allocated, all of it.
A clean per-store line should run roughly like this:
-
Net retail sales (what customers actually paid, by channel)
-
(−) Inter-site transfers received, at transfer price
-
(−) Direct COGS (product bought direct + transferred-in base)
-
= Gross margin
-
(−) Direct labor (that store's scoopers and shift leads)
-
(−) Direct occupancy (rent, utilities, that store's freezers)
-
= Store-level contribution
-
(−) Allocated shared services
-
= Fully-loaded store profit
That "store-level contribution" line — before shared services — is what tells you how good the store itself is. The fully-loaded number tells you whether it survives carrying its fair share of overhead.
Some useful unit metrics once you've got this cleaned up:
-
Contribution margin per labor hour — catches overstaffed stores that look fine on revenue
-
Transfer dependency ratio — how much of a store's product comes from internal transfers vs. direct buying (a store that's 70% transfer-fed isn't really standalone)
-
Revenue per square foot — levels the playing field between a tiny kiosk and a full parlor
-
Shared-service load % — allocated overhead as a share of store revenue
For the weekly rhythm that feeds all of this, the single-store discipline still applies per location — the one-page weekly P&L drill template is the right starting point before you try to roll multiple stores together. Run that per store, then consolidate.
The copy-paste 13-week consolidated forecast
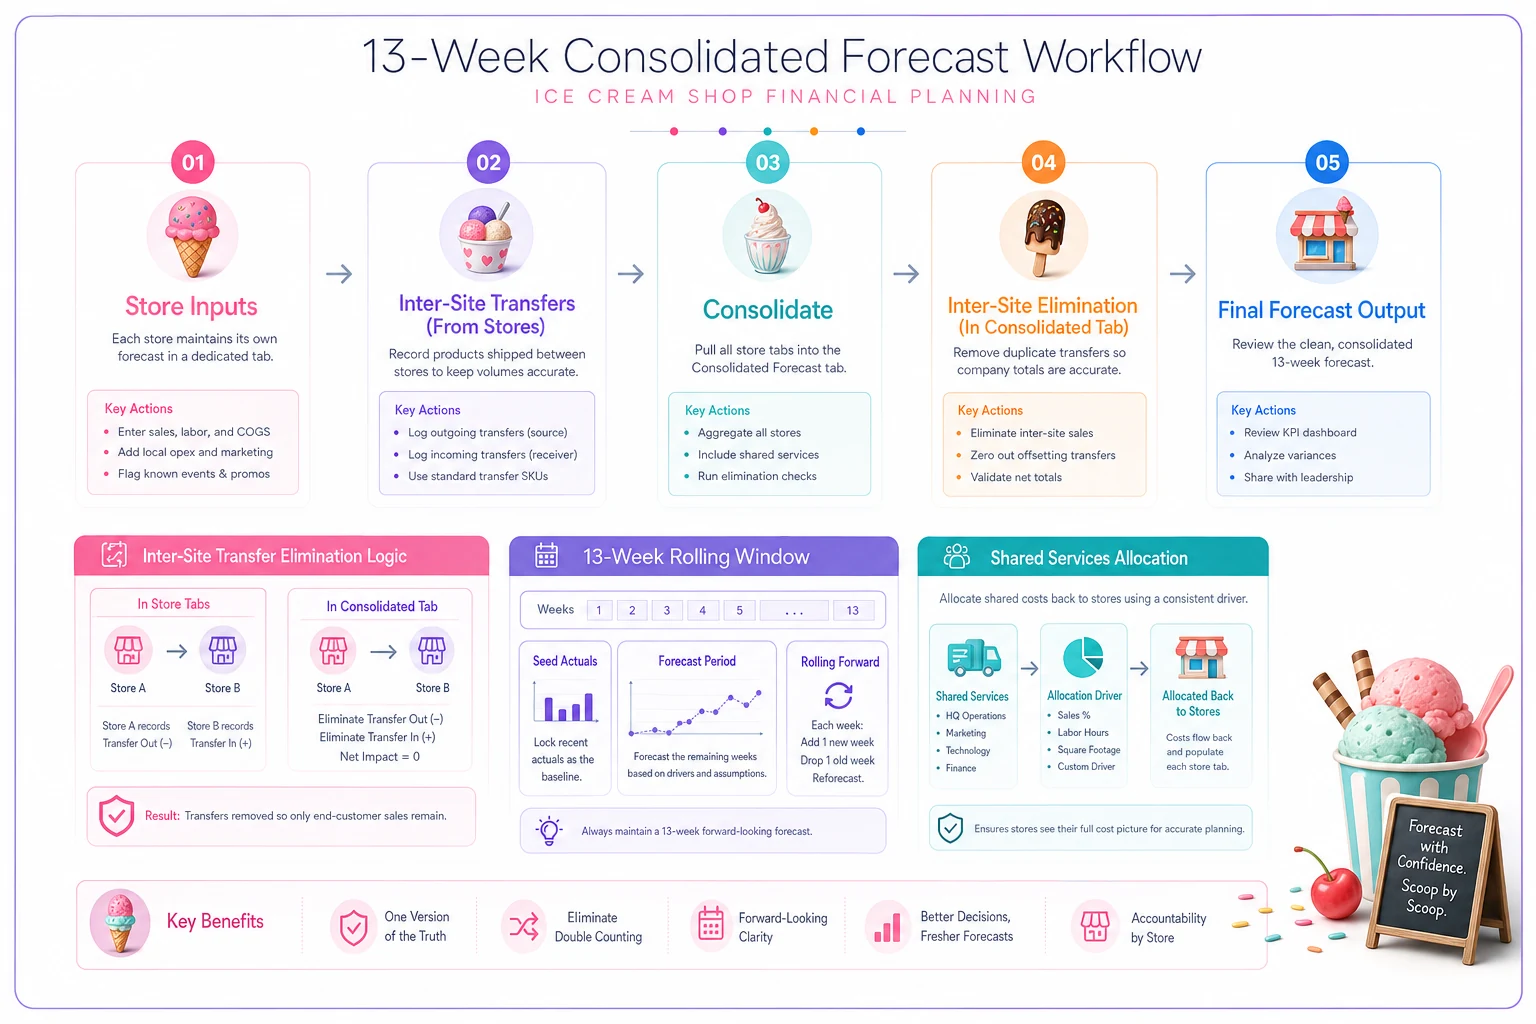
Thirteen weeks is the right horizon for scoop chains — long enough to see a season shift, short enough to actually stay accurate. Build one tab per store, then a consolidated tab that sums them and eliminates transfers.
The weekly columns (per store)
Week #, Week-ending date Forecast walk-in sales Forecast catering/wholesale sales Inter-site transfer revenue (if producing store) Total inflows --- Direct product purchases Inter-site transfer cost (if receiving store) Direct labor Occupancy (rent, utilities, freezer energy) Allocated shared services Total outflows --- Net weekly cash flow Running cash balance
The consolidated tab
Sum of all store inflows (−) Eliminate inter-site transfer revenue = Consolidated external revenue --- Sum of all store outflows (−) Eliminate inter-site transfer cost = Consolidated external costs --- Consolidated net weekly cash flow Consolidated running cash balance Minimum cash threshold (alert line)
Here's a simple workflow for building the 13-week consolidated forecast.
How to actually fill it in
-
Seed each store with 4–6 weeks of real weekly actuals so your base isn't fiction.
-
Apply your seasonal curve per store — a downtown lunch-crowd location and a suburban family store do not share a demand shape.
-
Layer transfers in explicitly — if Store A produces for B and C, its transfer revenue weeks should mirror their transfer cost weeks exactly.
-
Allocate shared services weekly, not in one lumpy monthly hit, so your running cash balance stays realistic.
-
Set a minimum cash threshold line per store and consolidated. When the forecast dips below it, you have weeks of warning, not days.
-
Re-forecast every week — roll the window forward, replace the oldest forecast week with actuals, and watch your forecast error shrink.
Seasonality will dominate this forecast for most scoop chains, and the cash timing is brutal if you don't plan for it. The seasonal cashflow playbook pairs directly with this template — the 13-week model tells you when cash gets tight across the chain, that playbook tells you what to do about it.
A real scenario: three stores, one hidden loser
A small chain — three locations, one of them a production-heavy "mother" store with the big walk-in. Combined revenue around $95k a month in peak season. On the surface, healthy. The owner thought the mother store was the weak link because its food cost ran close to 42%, way above the other two sitting around 28%.
-
The mother store's standalone contribution went from looking like a loss to roughly $3k–$4k monthly positive — it had been the engine the whole time.
-
One of the "good" stores, the one that looked like the model, turned out to be riding free transferred product. Fully loaded, its real margin was thinner than anyone believed, and its labor-per-contribution-hour was the worst of the three.
Nothing about the actual operations changed that month. Same tubs, same staff, same sales. All that changed was the attribution — and it completely reversed which store they were planning to expand and which one needed a hard look. That's the entire point of doing this right.
When this level of rigor makes sense — and when it doesn't
Build the full model when:
-
You have three or more locations, or two plus a commissary
-
Product moves between stores regularly
-
You share staff, marketing, or admin across locations
-
You're deciding where to open next and need honest per-store numbers
You can keep it lighter when:
-
You run two fully independent stores with no shared production and separate everything — clean standalone P&Ls per store may be enough
-
You're pre-second-store — nail single-store weekly discipline first; don't build consolidation machinery for a business you don't have yet
Who should NOT do this yet:
If you can't reliably close a clean weekly P&L for one store, don't bolt on inter-site transfers and allocations. You'll just build a bigger, more confident wrong answer. Get one store's numbers trustworthy, then scale the model.
Where the manual version falls apart
The model above works fine in a spreadsheet — until the volume of transfer slips and weekly reconciliations outgrows what one person can hand-key.
Around the four-to-five store mark, the reconciliation burden quietly becomes a part-time job, and that's usually when the errors creep back in. Operational software that pulls POS data, logs transfers, and auto-eliminates intercompany lines earns its keep here — not because the method changes, but because the consistency stops depending on someone remembering to log every tub on a busy Saturday. The method is the same whether you run it by hand or with a platform handling the plumbing; software just keeps the discipline from slipping when you're not watching.
Multi-location scoop chains rarely fail because of bad ice cream. They drift because the owner loses the ability to see each store clearly once the stores start sharing product, staff, and costs. Fix that, and most of the hard decisions — where to expand, which store to fix, when to worry about cash — basically answer themselves.
Three disciplines carry the whole thing: price your inter-site transfers consistently and eliminate them in consolidation, allocate shared services by honest drivers instead of lazy revenue splits, and run a rolling 13-week forecast per store and chain-wide. Do those three, keep the transfer logging tight, and you'll always know which of your counters is pulling the chain forward and which one needs you behind it this weekend.
Ready to scoop up efficiency and grow your shop?
Join hundreds of ice cream shops using Cremyly to boost productivity, reduce waste, and delight customers with faster service.