

Most scoop shops don't have a "too many flavors" problem on paper. They have a freezer problem that looks like a flavor problem. You've got 32 tubs crammed into display cabinets built for 24, three backup tubs double-stacked in the walk-in, and a rotation schedule that only your best closer actually understands. Then one slow Tuesday you realize half your menu turns once every three weeks while Vanilla and Cookies & Cream do 40% of your volume.
That's why menu rationalization in an ice cream shop is harder than in almost any other food business. You're not just scoring profit. You're scoring profit per cubic foot of freezer — and freezer space is the one constraint you can't flex on a busy weekend.
This post walks through a scoring matrix that weights turn rate, margin, and training cost, a simple spatial-capacity calculator tied to your actual cabinet layout, and a quarterly cadence so you're not making these cuts emotionally in the middle of August.
Why most flavor cuts get made badly
The typical rationalization decision happens one of two ways, and both are flawed.
The first is the "gut cut." Owner walks past the cabinet, notices Lavender Honey hasn't moved, and 86's it. The problem is gut feel over-indexes on recent memory. A flavor that bombed for three weeks might be a strong fall seller you pulled too early. And it ignores the hidden drag of flavors that sell "okay" but take forever to scoop, train on, or re-freeze correctly.
The second is the "spreadsheet cut" — ranking everything by gross margin and chopping the bottom. This one feels rigorous but misses the whole point of a freezer-constrained business. A high-margin flavor that turns once every 18 days is worse for you than a medium-margin flavor that sells out twice a week, because the slow one is physically occupying a well you could be using to double-face a winner.
What's missing from both approaches is a combined view: profitability, velocity, and the operational cost of keeping that SKU alive. That third factor — training and handling cost — is the one almost nobody scores, and it's often where the quiet money leaks out.
The three inputs that actually matter
Turn rate. Not units sold — turns. How many times does that tub's worth of product fully cycle through in a given window? A tub that sells out in 4 days turns roughly 7–8 times a month. One that lingers 20 days turns about 1.5 times. Turn rate is your single best signal of freezer efficiency, because it directly answers "how much selling is this well doing for me?"
Keep your ice cream shop running smoothly.
Cremyly helps you manage every order, stock level, and staff shift with precision and ease.
- Real-time inventory tracking
- Order management dashboard
- Staff scheduling & shift coordination
No credit card required
Margin per scoop. You need true per-scoop margin, not menu price minus a vague food cost. That means accounting for actual portioned yield, overrun, and the mix-ins that ride along. If you haven't nailed this down, your scoring will be built on sand — the groundwork in calculating per-scoop cost and setting profitable prices is worth doing before you run any of this.
Training & handling cost. This is the sleeper. Some flavors are a pain: they need a specific temper time, scoop hard and cause hand fatigue, have a mix-in that staff under- or over-portion, or require a special allergen protocol. Every one of those adds minutes and mistakes. A flavor that needs a 20-minute temper before it's scoopable and causes two remakes a shift carries a real labor tax even if its margin looks fine on paper.
Building the scoring matrix
Score each flavor 1–5 on the three dimensions, then weight them. The weighting is the part people get wrong — in a freezer-constrained shop, turn rate should carry the most weight, because space is your binding constraint.
Here's a weighting that works well as a starting point:
| Dimension | What a 5 looks like | What a 1 looks like | Weight |
|---|---|---|---|
| Turn rate | Sells out in ~4 days or less | Turns under ~2x/month | 45% |
| Margin per scoop | Top quartile of your menu | Bottom quartile | 35% |
| Training/handling cost | Scoops clean, no special temper, no mix-in errors | Needs special handling, frequent remakes | 20% |
Multiply each score by its weight, sum it, and you get a composite out of 5. A flavor scoring 4.0+ is a core keeper. 3.0–3.9 is solid, leave it alone. 2.0–2.9 is a watch-list candidate. Below 2.0 is a cut candidate — unless it's playing a strategic role (more on that below).
A worked example. Say you're scoring four flavors:
-
Salted Caramel turns 6x/month (5), top-quartile margin (5), scoops clean (5) → 0.45(5) + 0.35(5) + 0.20(5) = 5.0
-
Mango Sorbet turns 3x/month (3), high margin (4), scoops hard when cold, occasional over-portion (3) → 1.35 + 1.40 + 0.60 = 3.35
-
Lavender Honey turns 1.3x/month (1), highest margin on the board (5), fiddly swirl, frequent remakes (2) → 0.45 + 1.75 + 0.40 = 2.60
-
Birthday Cake turns 2x/month (2), mid margin (3), sprinkle mix-in constantly spills and over-portions (2) → 0.90 + 1.05 + 0.40 = 2.35
Notice Lavender Honey has your best margin and still lands on the watch list. On a margin-only cut it would've survived while something more deserving got chopped. That's the whole point of the three-factor view.
The spatial-capacity calculator
Scoring tells you what each SKU is worth. The spatial calculator tells you how many wells you've actually got to work with — and forces the trade-off that makes rationalization real.
-
Count your true display wells. Not backups, not walk-in storage — the actual customer-facing dipping positions. Say you've got 24.
-
Decide your double-facing budget. Your top sellers deserve two wells so you're not swapping tubs mid-rush. If your top 5 flavors each get a second well during peak season, that's 5 extra wells spoken for, leaving 19 for everything else.
-
Reserve a rotation/test slot or two. If you run seasonal or test flavors — and you should, using something like the approach in running low-waste test windows and retiring flavors on sales triggers — hold back 2 slots. Now you're at 17.
-
That 17 is your hard menu ceiling for permanent SKUs. Not a suggestion. A ceiling.
The math that matters: permanent SKUs = display wells − double-facing − test/rotation reserve. If your scoring matrix has 23 flavors above the cut line but your calculator says 17, you have a forced ranking problem — the bottom 6 "survivors" are competing for space that doesn't exist, and that's exactly what rationalization is supposed to resolve.
If your scoring matrix has 23 flavors above the cut line but your calculator says 17, you have a forced ranking problem — the bottom 6 "survivors" are competing for space that doesn't exist, and that's exactly what rationalization is supposed to resolve.
Here's a simple visual workflow for calculating spatial capacity.
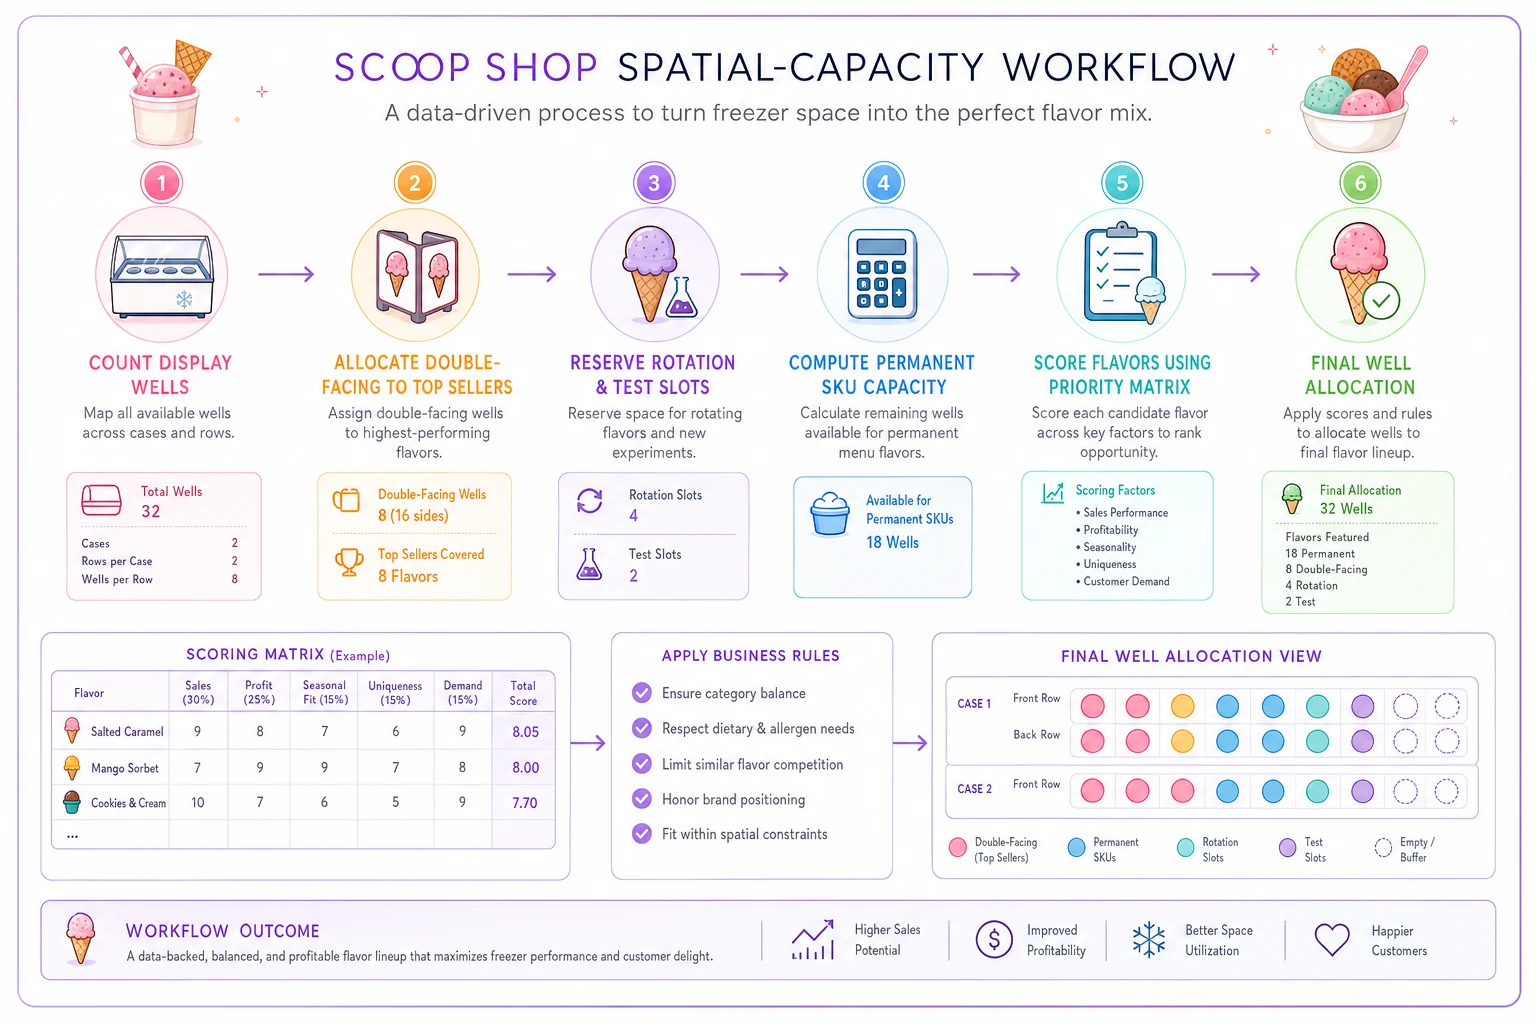
This is where the two tools work together. The matrix ranks. The calculator caps. The flavors between the cap and the cut line are your real decision zone — the ones good enough to keep but not good enough to guarantee a well.
When turn rate and freezer reality collide
Slow-turning flavors don't just waste a well, they degrade. A tub turning 1.5x a month is sitting open-faced in a display cabinet for two-plus weeks, cycling through frost build-up, surface melt-and-refreeze, and texture loss. By the time the last scoops go out, quality has dropped and you're more likely to get a reject or a redip.
So a low turn rate carries a double penalty: opportunity cost on the space and a quality tax on the product itself. If you want to get rigorous about which tubs are aging past their window, the freeze/thaw and yield mechanics in the perishable inventory system for frozen dessert shops pair naturally with turn-rate scoring — a flavor that scores low on turns is often the same one blowing past its freeze window.
When a flavor sits in the 2.0–2.9 band and keeps hitting its freeze-window limit, that's two independent signals pointing at a cut. Stop debating it.
A quarterly rationalization cadence
Doing this once and calling it done is the biggest mistake. Turn rates swing hard by season — Lavender Honey that bombs in January might be a top-5 spring flavor. A quarterly cadence lets you cut without over-reacting to a single bad stretch.
-
Late winter (Feb) Score the whole board using fall/winter data. This is your deepest cut of the year — slow season exposes the dead weight. Tighten to your spatial cap before spring volume arrives.
-
Late spring (May) Lighter review. You're mostly adding back seasonal winners and confirming double-facing is set for the summer rush. Don't cut aggressively here — you need breadth for peak traffic.
-
Late summer (Aug) Mid-cycle check. Pull the obvious summer failures, but hold back — you're about to shift into fall flavors.
-
Late fall (Nov) Score with summer's full data set. Decide which seasonals earned a permanent slot and which go back in the rotation reserve.
The rule that keeps this sane: no flavor gets cut on a single quarter's data unless it's below 2.0 two reviews in a row, or it's a clear operational hazard. This prevents the whiplash of yanking flavors that are just seasonally quiet.
Keeping the data honest
The whole system falls apart if your turn-rate and margin numbers are guesses. This is the part that actually takes work, and it's usually where shops stall.
You need POS data clean enough that each flavor's unit velocity is trustworthy, portion yields consistent enough that margin-per-scoop means something, and some record of handling issues — remakes, over-portions, temper complaints — to score the training cost dimension. In a lot of shops, that third one lives only in a manager's head.
Log handling issues in a consistent place so your training/handling scores reflect reality rather than memory.
Operational software that ties your POS velocity, portion costs, and waste logs into one view earns its keep here — not because it makes the decision for you, but because it stops you from scoring flavors on stale or incomplete numbers. When turn rate is pulled straight from sales data and handling issues are logged consistently instead of remembered selectively, the matrix produces rankings you can actually trust. The scoring and the spatial cap are simple arithmetic; the hard part is feeding them real numbers quarter after quarter without a spreadsheet archaeology project every February.
When this framework is overkill
If you run 12 flavors or fewer, you probably don't need a formal matrix. The slow movers are obvious and the freezer isn't your binding constraint. Spend your energy on portioning consistency instead.
If you're in your first peak season, hold off on aggressive cuts. You don't have enough turn-rate history to know what's genuinely weak versus just undiscovered. Run a full year before you start chopping on score.
If a low-scoring flavor is a signature or a traffic driver, score it, note it, and keep it anyway — with eyes open. The one dairy-free sorbet that keeps a group of regulars coming in can be worth more than its turn rate suggests. The matrix is a decision aid, not a dictator. The mistake is pretending the strategic exception is a profit decision when it's really a positioning one — be honest about which it is.
A real scenario
A single-location shop running 29 flavors in a 24-well cabinet had been double-stacking and swapping tubs mid-rush all summer, which slowed service and burned labor. Running the three-factor scoring, they found 8 flavors sitting below 2.5 — several with decent margins but turn rates under 2x a month, and two with constant mix-in remakes.
The spatial calculator put their real permanent ceiling at 18: 24 wells, minus five double-faced top sellers, minus one test slot. They cut to 18 permanent flavors plus a rotating seasonal, retiring six and moving two into a quarterly rotation instead of killing them outright.
The result over the following quarter wasn't a dramatic revenue jump — it was quieter and more useful. Tub swaps during peak dropped sharply, so service moved faster. Waste from slow-aging tubs fell noticeably because nothing was sitting open-faced for three weeks anymore. The freed-up wells let them double-face a seventh flavor during the rush, which smoothed out their worst mid-shift bottleneck. Roughly the same top line, meaningfully less chaos and less thrown-out product.
Bringing it together
Menu rationalization in a scoop shop isn't a profit exercise bolted onto a space problem — the space is the problem, and profit is just one of three inputs. Score flavors on turn rate, margin, and handling cost with turn rate weighted heaviest. Use the spatial calculator to set a hard ceiling on permanent SKUs. Then run it quarterly so seasonal swings don't trick you into cutting a flavor that was only sleeping.
The shops that get this right aren't the ones with the most flavors or the fanciest matrix. They're the ones who match their menu to their freezer, revisit it on a schedule, and keep their numbers clean enough to trust the score. Do that consistently, and the hard cuts stop feeling like guesses.
Menu rationalization in a scoop shop isn't a profit exercise bolted onto a space problem — the space is the problem, and profit is just one of three inputs. Score flavors on turn rate, margin, and handling cost with turn rate weighted heaviest. Use the spatial calculator to set a hard ceiling on permanent SKUs. Then run it quarterly so seasonal swings don't trick you into cutting a flavor that was only sleeping.
The shops that get this right aren't the ones with the most flavors or the fanciest matrix. They're the ones who match their menu to their freezer, revisit it on a schedule, and keep their numbers clean enough to trust the score. Do that consistently, and the hard cuts stop feeling like guesses.
Ready to scoop up efficiency and grow your shop?
Join hundreds of ice cream shops using Cremyly to boost productivity, reduce waste, and delight customers with faster service.